Monitoring docker containers using prometheus and grafana
We have already covered in previous posts the usage of tools via docker starting from building tools, continuous integration, integration testing. Now is time to share some thoughts about how easy is getting insights of our containers without modifying our applications using Grafana and prometheus
Our current approach for monitoring
There is a interesting piece which always helps developers when troubleshooting performance issues: monitoring.
Our applications are implemented using Spring Boot. We currently use the awesome JavaMelody that can be configured as a servlet to give us insights on what is going on each of our applications. You can see stats about nearly everything from application perspective
- HTTP stats: Execution times, errors, and you can break it down up to SQL level.
- SQL: Performance queries are available with their Explain plains.
- Java: We use Guice as CDI. Luckily enough a simple annotation in our classes enable time execution measurement even at method level.
For every aspect there are stats with times (maximum, minimum, mean, average), number of invocations , percentage within the set,etc so you can pinpoint exactly where you time is being spent and find obvious candidates for improvement in case such need arises.
Also the machine stats are available and you can inspect, pool, threads, system properties, JMX beans, etc.
So is really awesome, the only thing is that you need to hit a different url per application to get stats of the application. And you are also coupling the monitoring tool to your application as the jar library is part of your spring fat jar. Allegedly there is no impact in performance and we have to say that the tool has been paramount to reduce investigation vs resolution with tricky memory and performance issues.
The challenge
I do not think that anything can beat the information provided by JavaMelody perspective, but is likely that there best tools out there to do the job from system / infra perspective.
One thing I really miss from the current approach is that there is no way to set alerts or threshold values that enable triggering of notifications vis different channels when things go wrong.
So I started to explore alternatives using different toolsets, decoupled from our application and using docker to keep going these series of post about using docker to improve the software development lifecycle.
What I really needed was something lean I could spin up in a docker container. Ideally I would like to add my own graphs, criterias according to my specific needs. I work in an awesome company Piksel and I asked to our work mates what where they using to monitor the platforms we run. Words like BigBrother, Nagios, Sensus, New Relic, Grafana, Cronograph, Prometheus Monitoring, Graphite, Cronograph, Datadog sounded like gibberish to me… so time to do some research.
For this proof of concept I ruled out those that can be considered expensive or complex like Nagios, Sensus, New Relic.
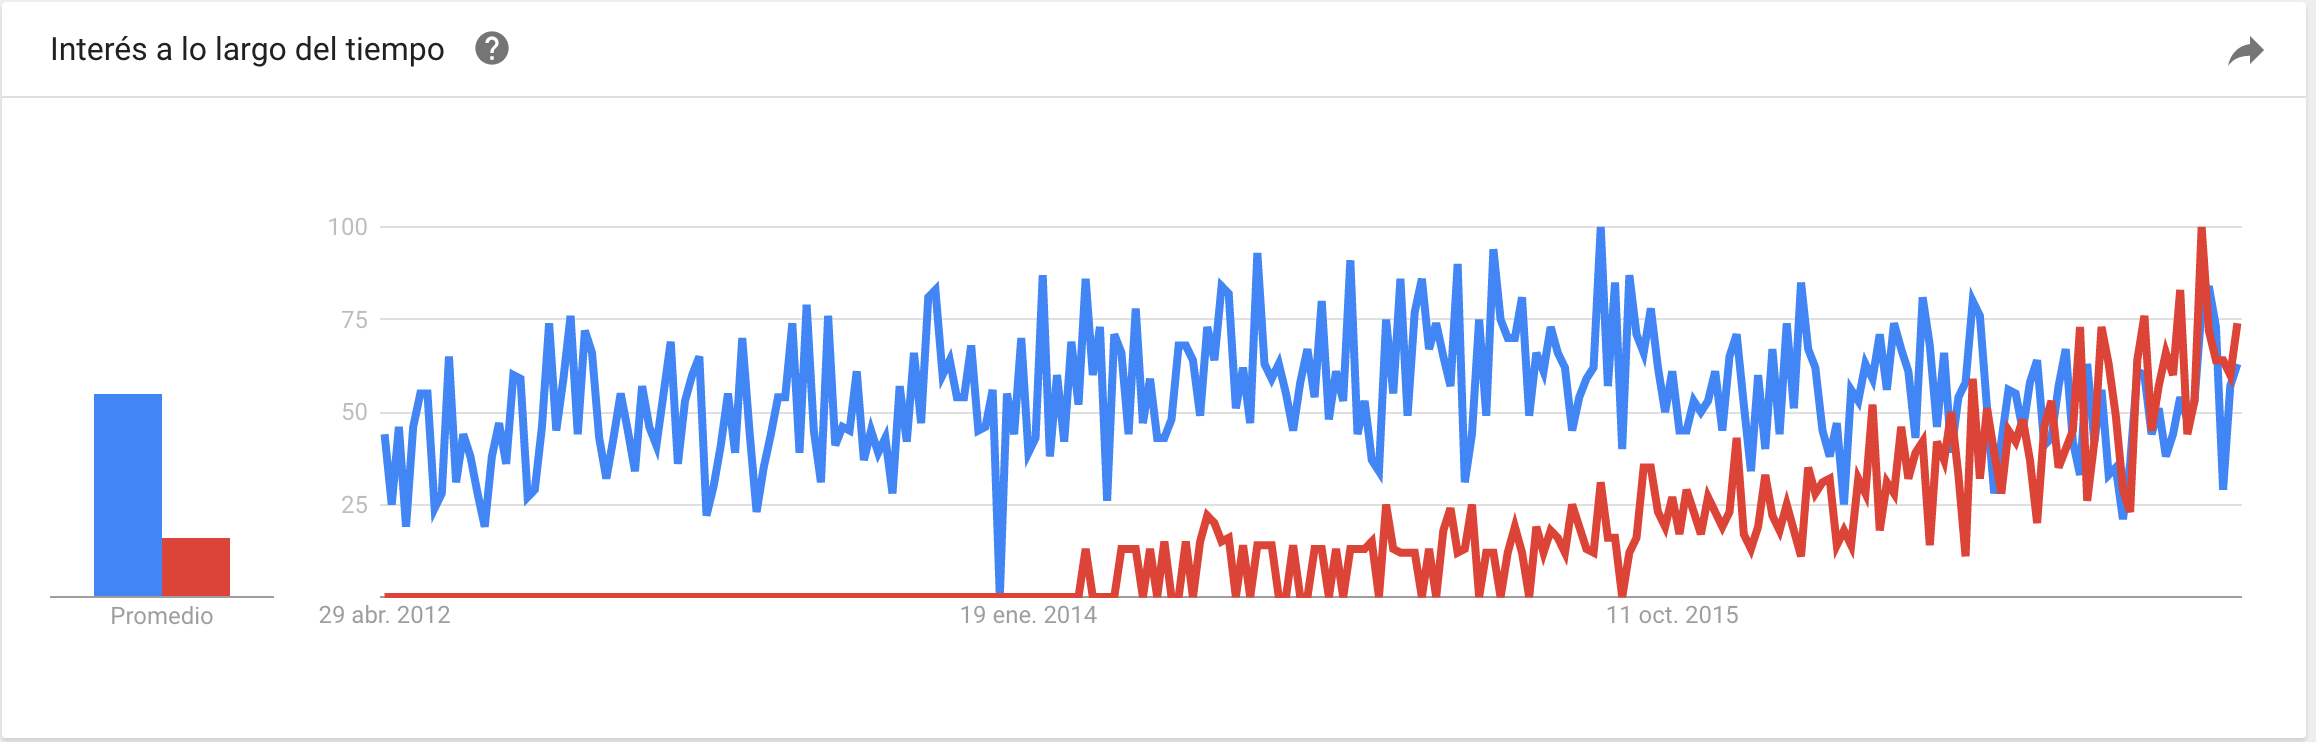
Using Google trends clearly show that Cronograph does not seem to keep the trend of the main leaders. So my 2 final candidates where Graphite and Grafana. See below the image where you can see that Grafana now is the leading the race
With Prometheus Monitoring you can scrap statistics from applications as far they are exposed in the right format. Grafana provides a nice UI to explore them. So theoretically I could provide an endpoint /metrics to each application and configure my docker-compose up file including prometheus config file where the list of scraping urls are defined. This is how my config file should look like
 global:
   scrape_interval:     15s # By default, scrape targets every 15 seconds.

   # Attach these labels to any time series or alerts when communicating with
   # external systems (federation, remote storage, Alertmanager).
   external_labels:
     monitor: 'codelab-monitor'

 # A scrape configuration containing exactly one endpoint to scrape:
 # Here it's Prometheus itself.
 scrape_configs:
   # The job name is added as a label `job=<job_name>` to any timeseries scraped from this config.
   - job_name: 'prometheus'

     # Override the global default and scrape targets from this job every 5 seconds.
     scrape_interval: 5s

     static_configs:
       - targets: ['localhost:9090','localhost:8001',...and so on]
Adding metrics to our Spring Boot apps
Next step would be would be adding the “/metrics” endpoint to each application. SpringBoot makes the task extremely easy.
1. Add POM dependencies
 <!-- Hotspot JVM metrics -->
  <dependency>
       <groupId>io.prometheus</groupId>
       <artifactId>simpleclient_hotspot</artifactId>
       <version>${prometheus.version}</version>
  </dependency>
  <!-- Exposition servlet -->
  <dependency>
       <groupId>io.prometheus</groupId>
       <artifactId>simpleclient_servlet</artifactId>
       <version>${prometheus.version}</version>
  </dependency>
  <!-- The client -->
  <dependency>
       <groupId>io.prometheus</groupId>
       <artifactId>simpleclient</artifactId>
       <version>${prometheus.version}</version>
  </dependency>
2. Define a configuration class using the Prometheus client
That was fast! But can be done even faster using the enablers actions provided by the Prometheus client
 @EnablePrometheusEndpoint
 @EnableSpringBootMetricsCollector
The challenge
Would it not be great if I had “something” that automatically exposes stats from my containers .. but without modifying my applications?
After some google research I found an interesting combination involving Docker, Google cadvisor, Prometheus Monitoring and Grafana which sounded an excellent candidate. The solution can be summarized in the high level diagram
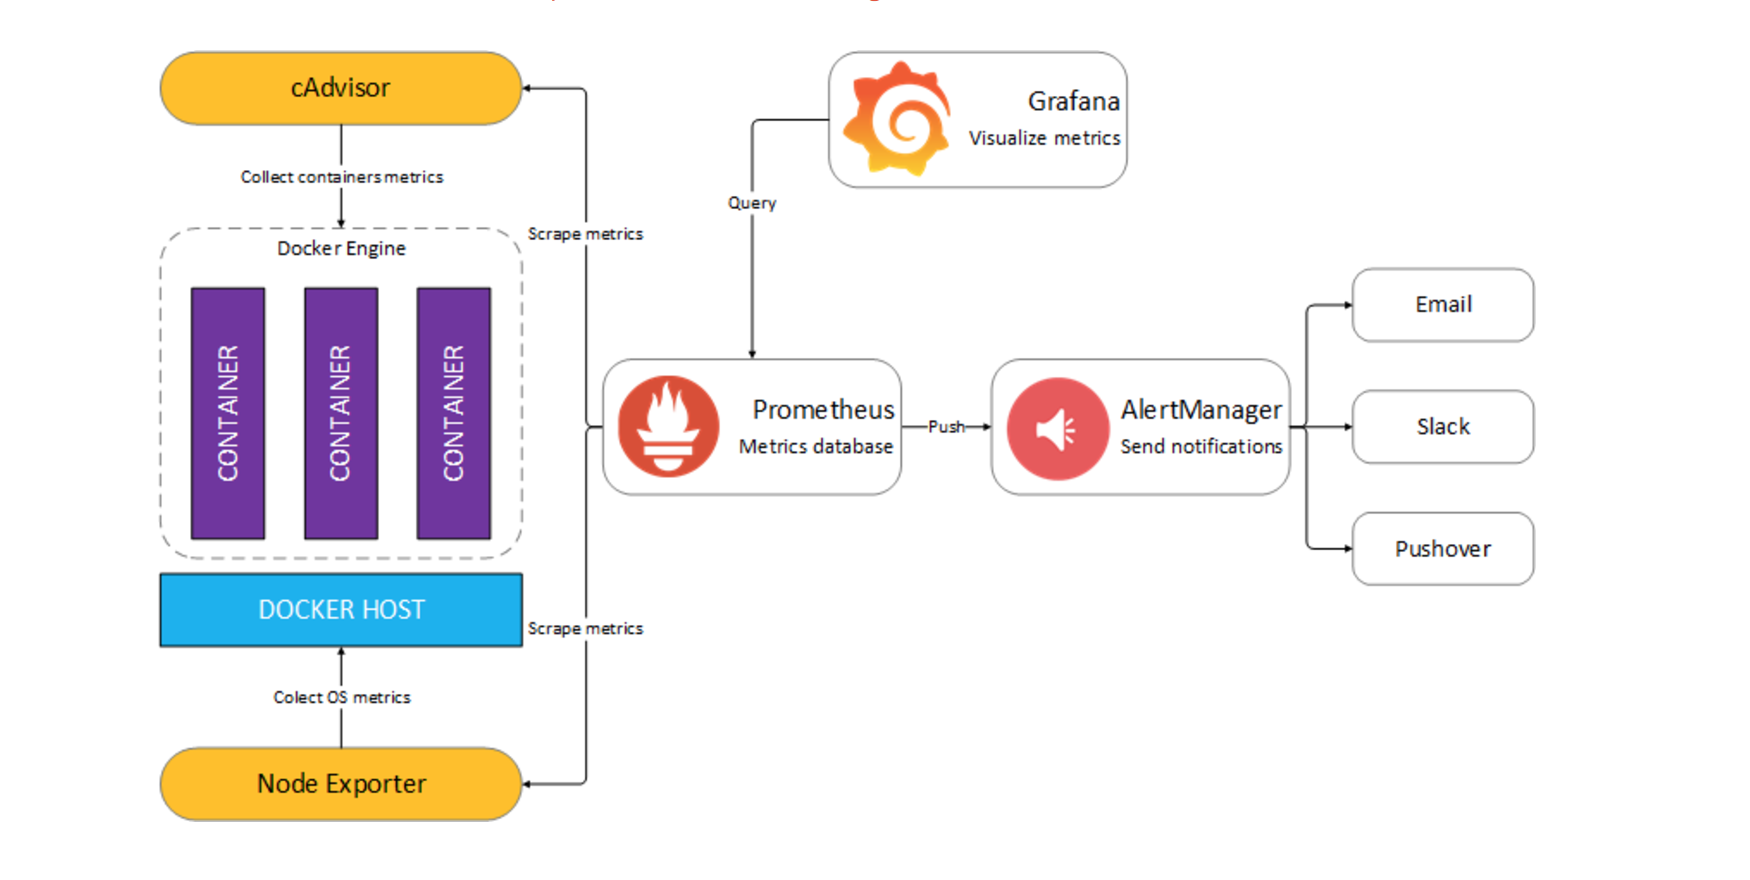
The compoments are:
- Prometheus (metrics database) http://
:9090 - AlertManager (alerts management) http://
:9093 - Grafana (visualize metrics) http://
:3000 - NodeExporter (host metrics collector)
- cAdvisor (containers metrics collector)
Let´s get our hands dirty!
1. Enable experimental daemons tracking feature
First you need to be sure that Docker is started with the metric experimental feature. In Mac you can configure through the console panel
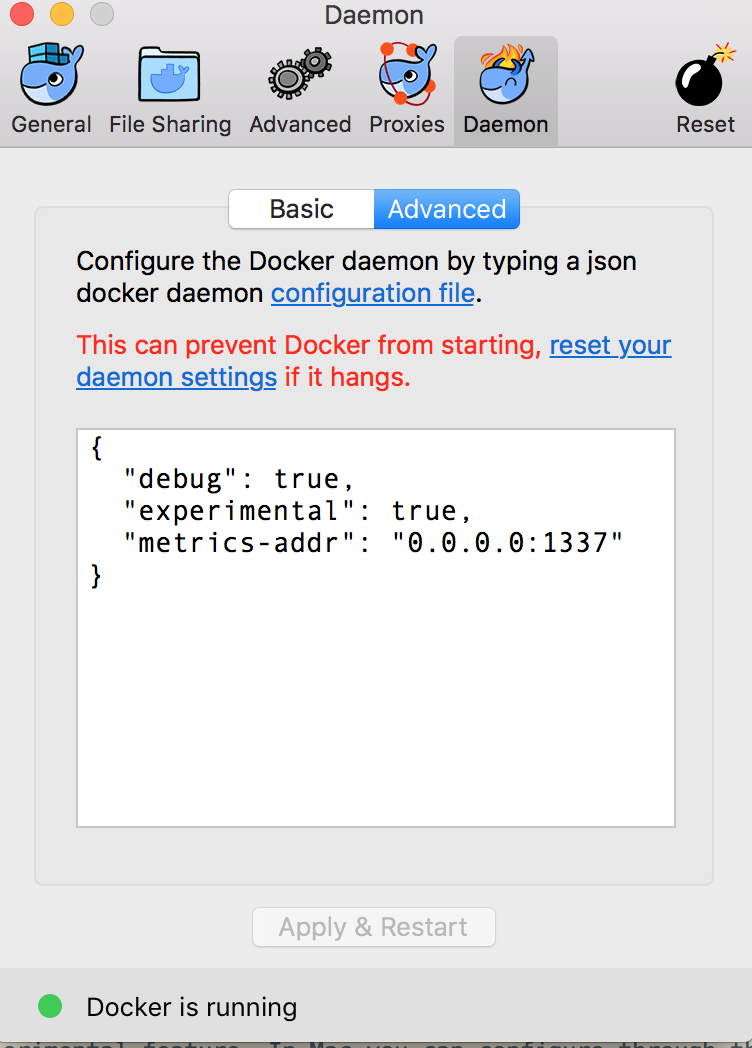
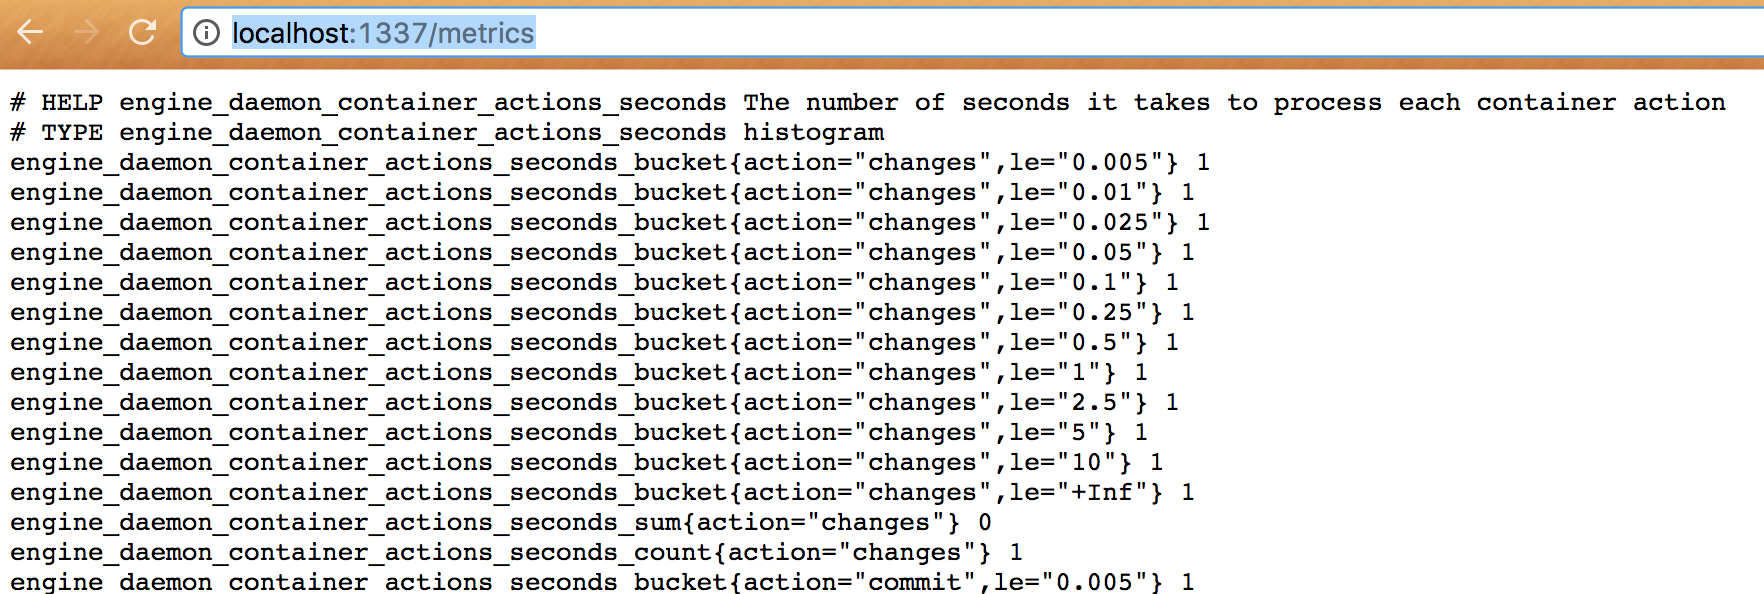
Once you change it, Docker will restart automatically. If everything is ok you should be able to hit in your browser http://localhost:1337/metrics and see something like:
2. Start the docker compose stack
 git clone https://github.com/stefanprodan/dockprom
 cd dockprom
 docker-compose up -d
In the following screenshot you can see how my containers look like. You can see two different sets. One is the solution itself, and the others are some containers I have running related with logging using ELK stack.
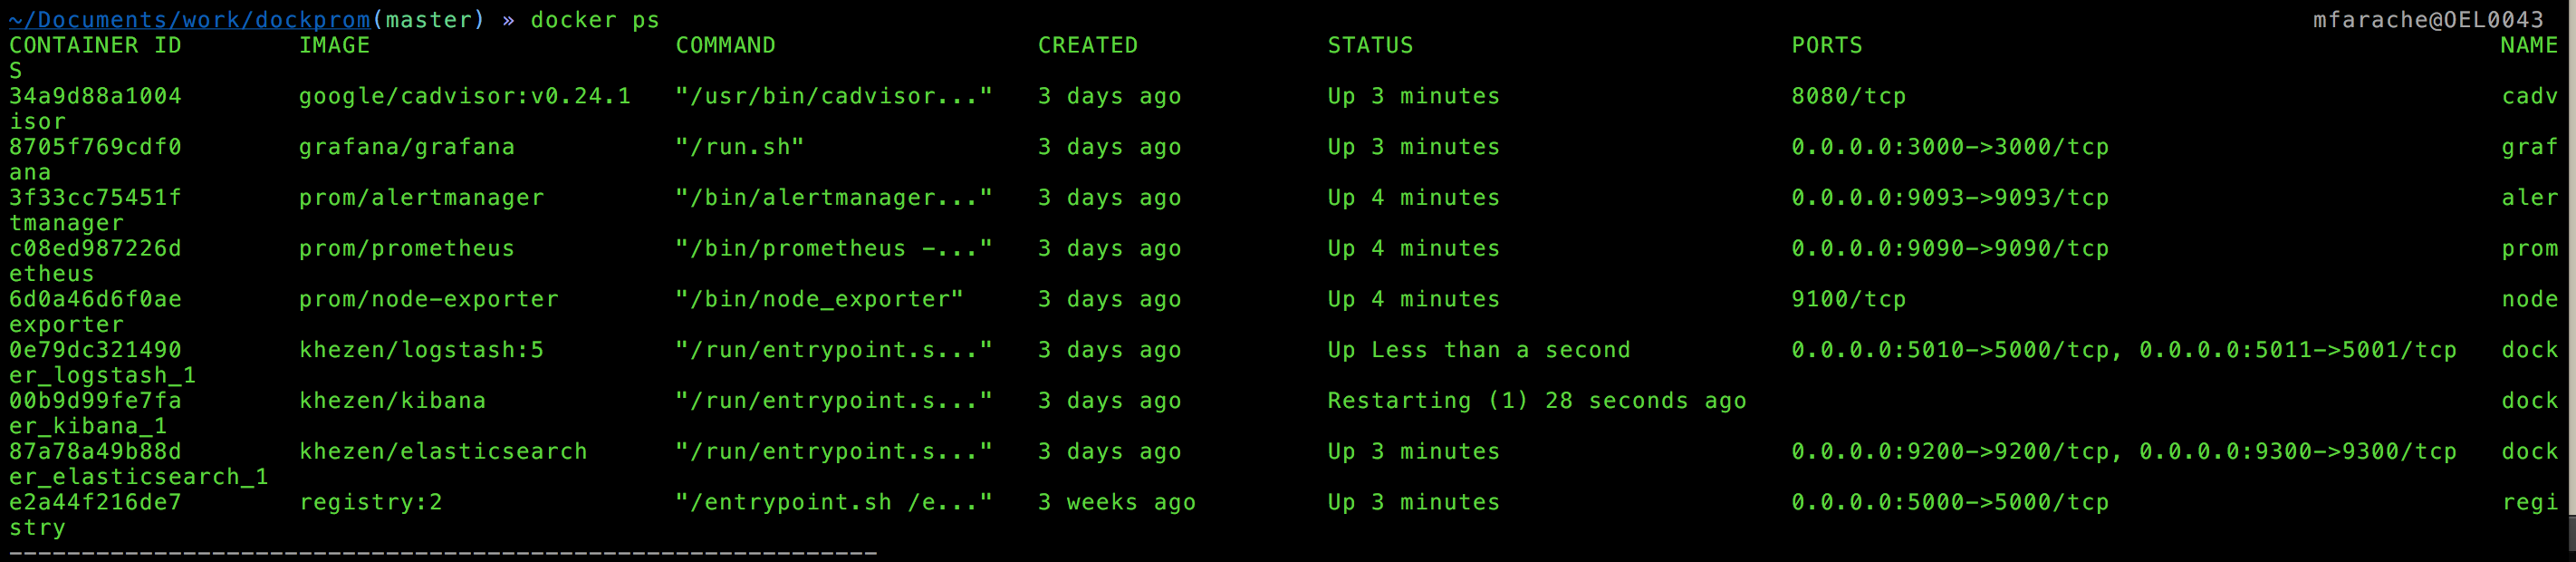
3.1 Configure Grafana. Add datasource
Fire your browser and hit http://localhost:3000 with credentials
Add a Prometheus datasource, the defaults are ok as we running prometheus in localhost:9090. Use local (not proxy otherwise Grafana will get 502 Errors when requesting status test page). We will run without any HTTP or security as
3.2 Configure Grafana. Import Dashboards
Click on Dahsboards / Import / Upload json file
There are useful dashboard definition in the git repository
~/Documents/work/dockprom/grafana(master) » ls -latr                                                                                   mfarache@OEL0043total 248
-rw-r--r--   1 mfarache  staff   9945 Apr 23 09:01 nginx_container.json
-rw-r--r--   1 mfarache  staff  34171 Apr 23 09:01 monitor_services.json
-rw-r--r--   1 mfarache  staff  37470 Apr 23 09:01 docker_host.json
-rw-r--r--   1 mfarache  staff  33763 Apr 23 09:01 docker_containers.json
drwxr-xr-x   6 mfarache  staff    204 Apr 23 09:01 .
drwxr-xr-x  16 mfarache  staff    544 Apr 23 09:39 ..
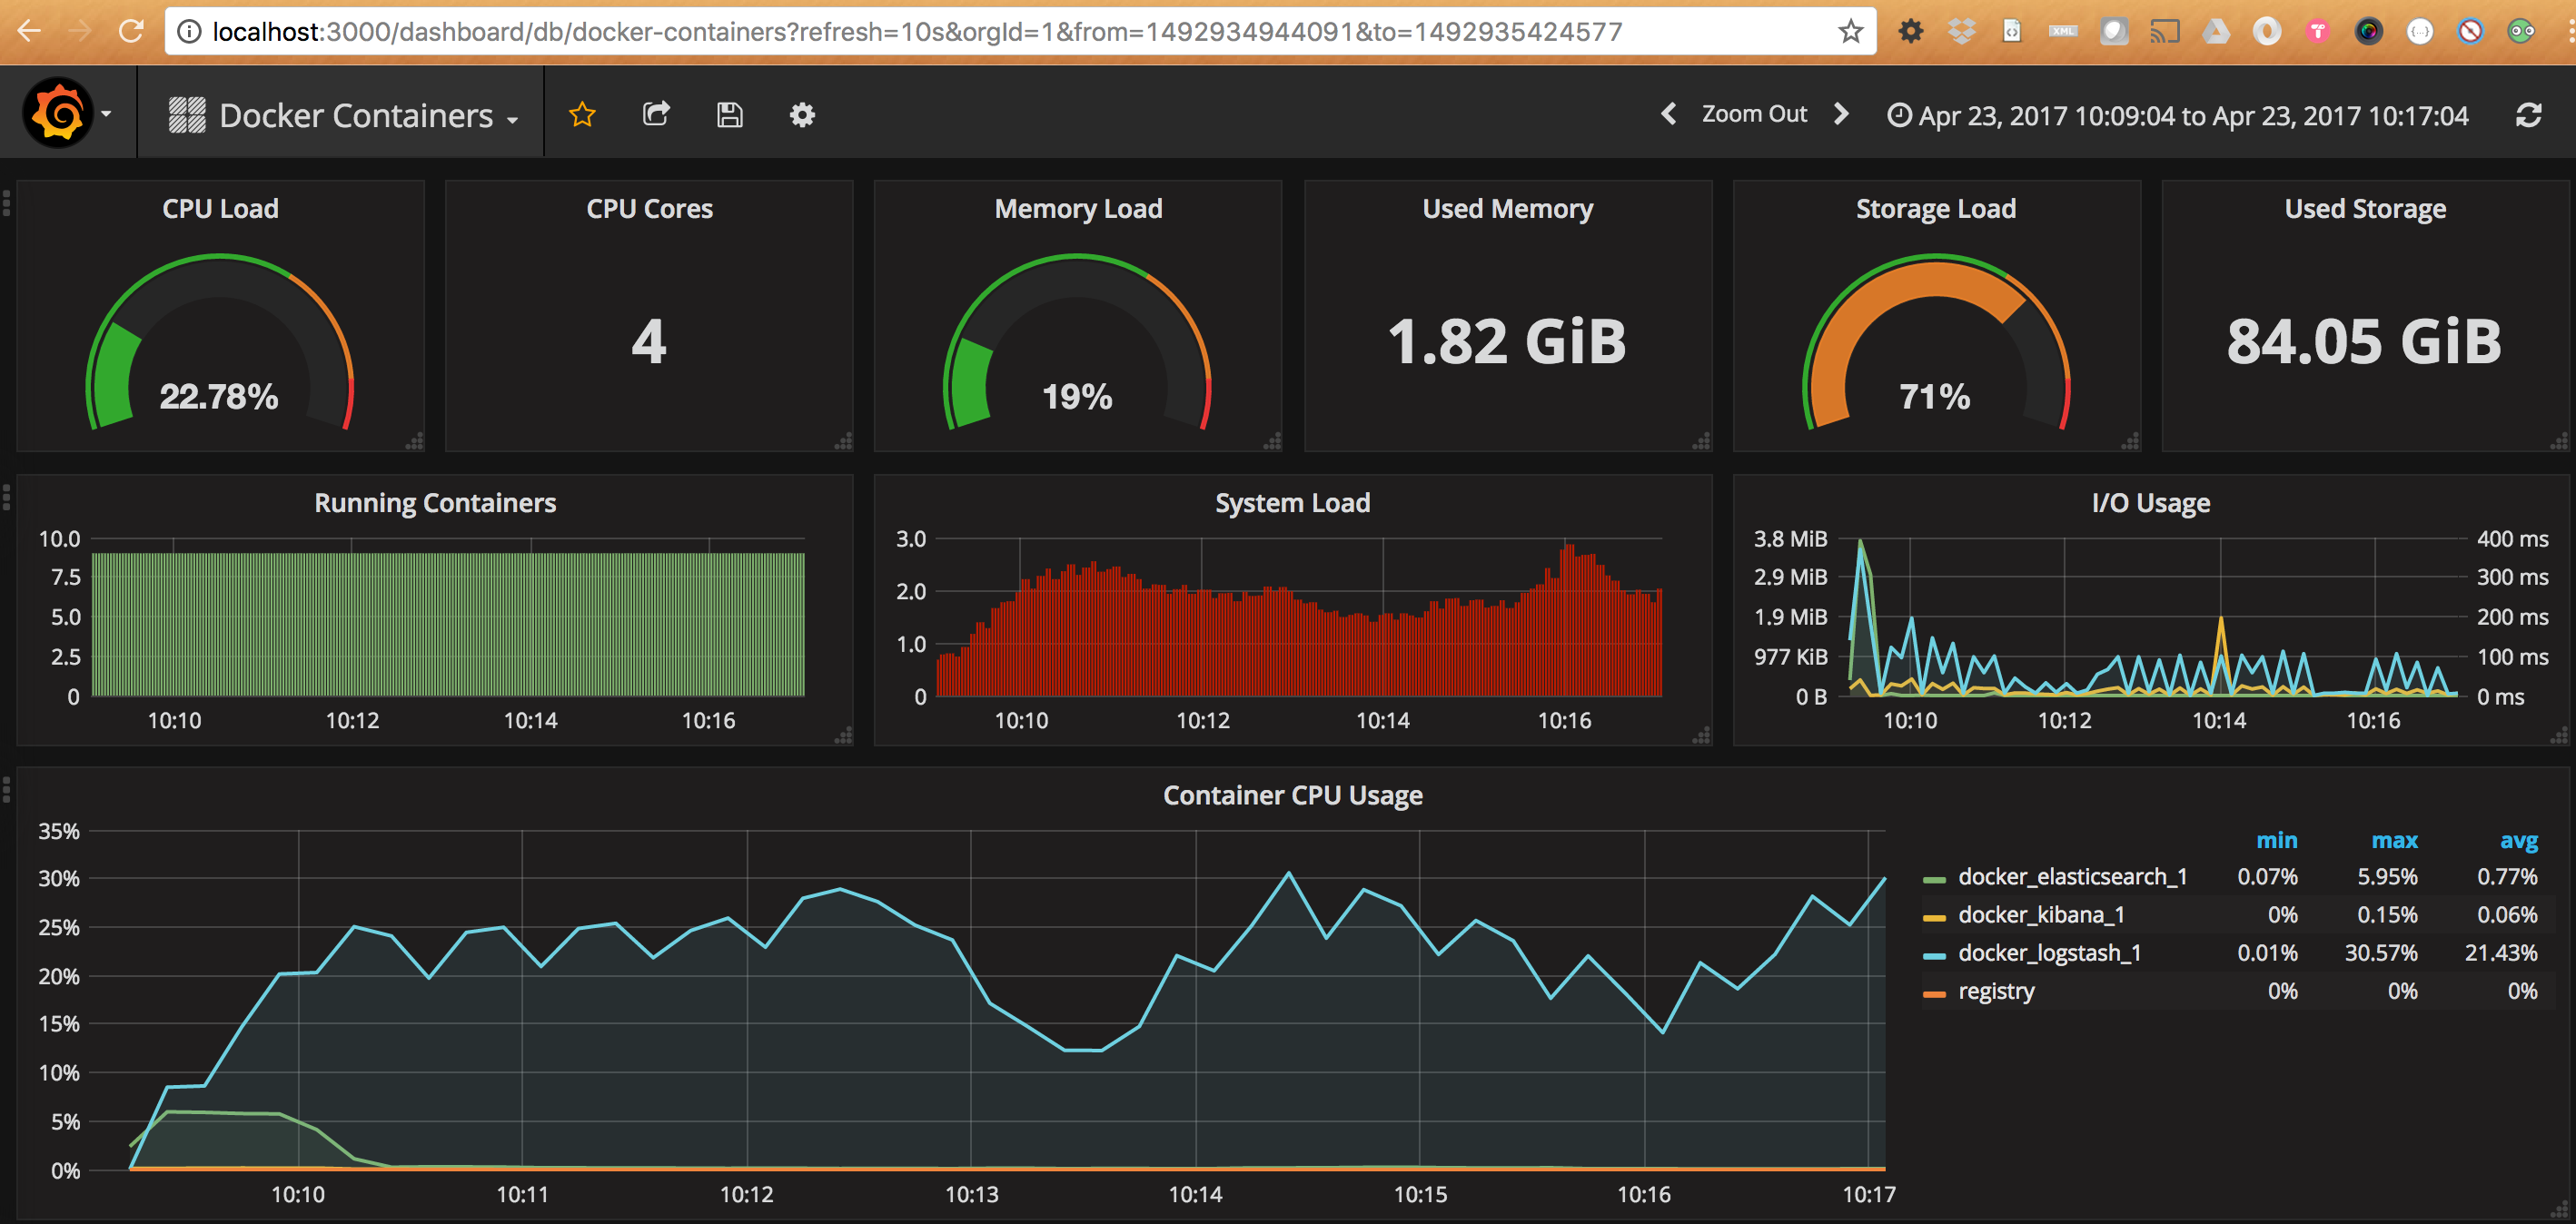
Play around!
Lets have a look to our Docker containers dashboard. We can see interesting data like
- Total containers CPU load, memory and storage usage
- Running containers graph, system load graph, IO usage graph
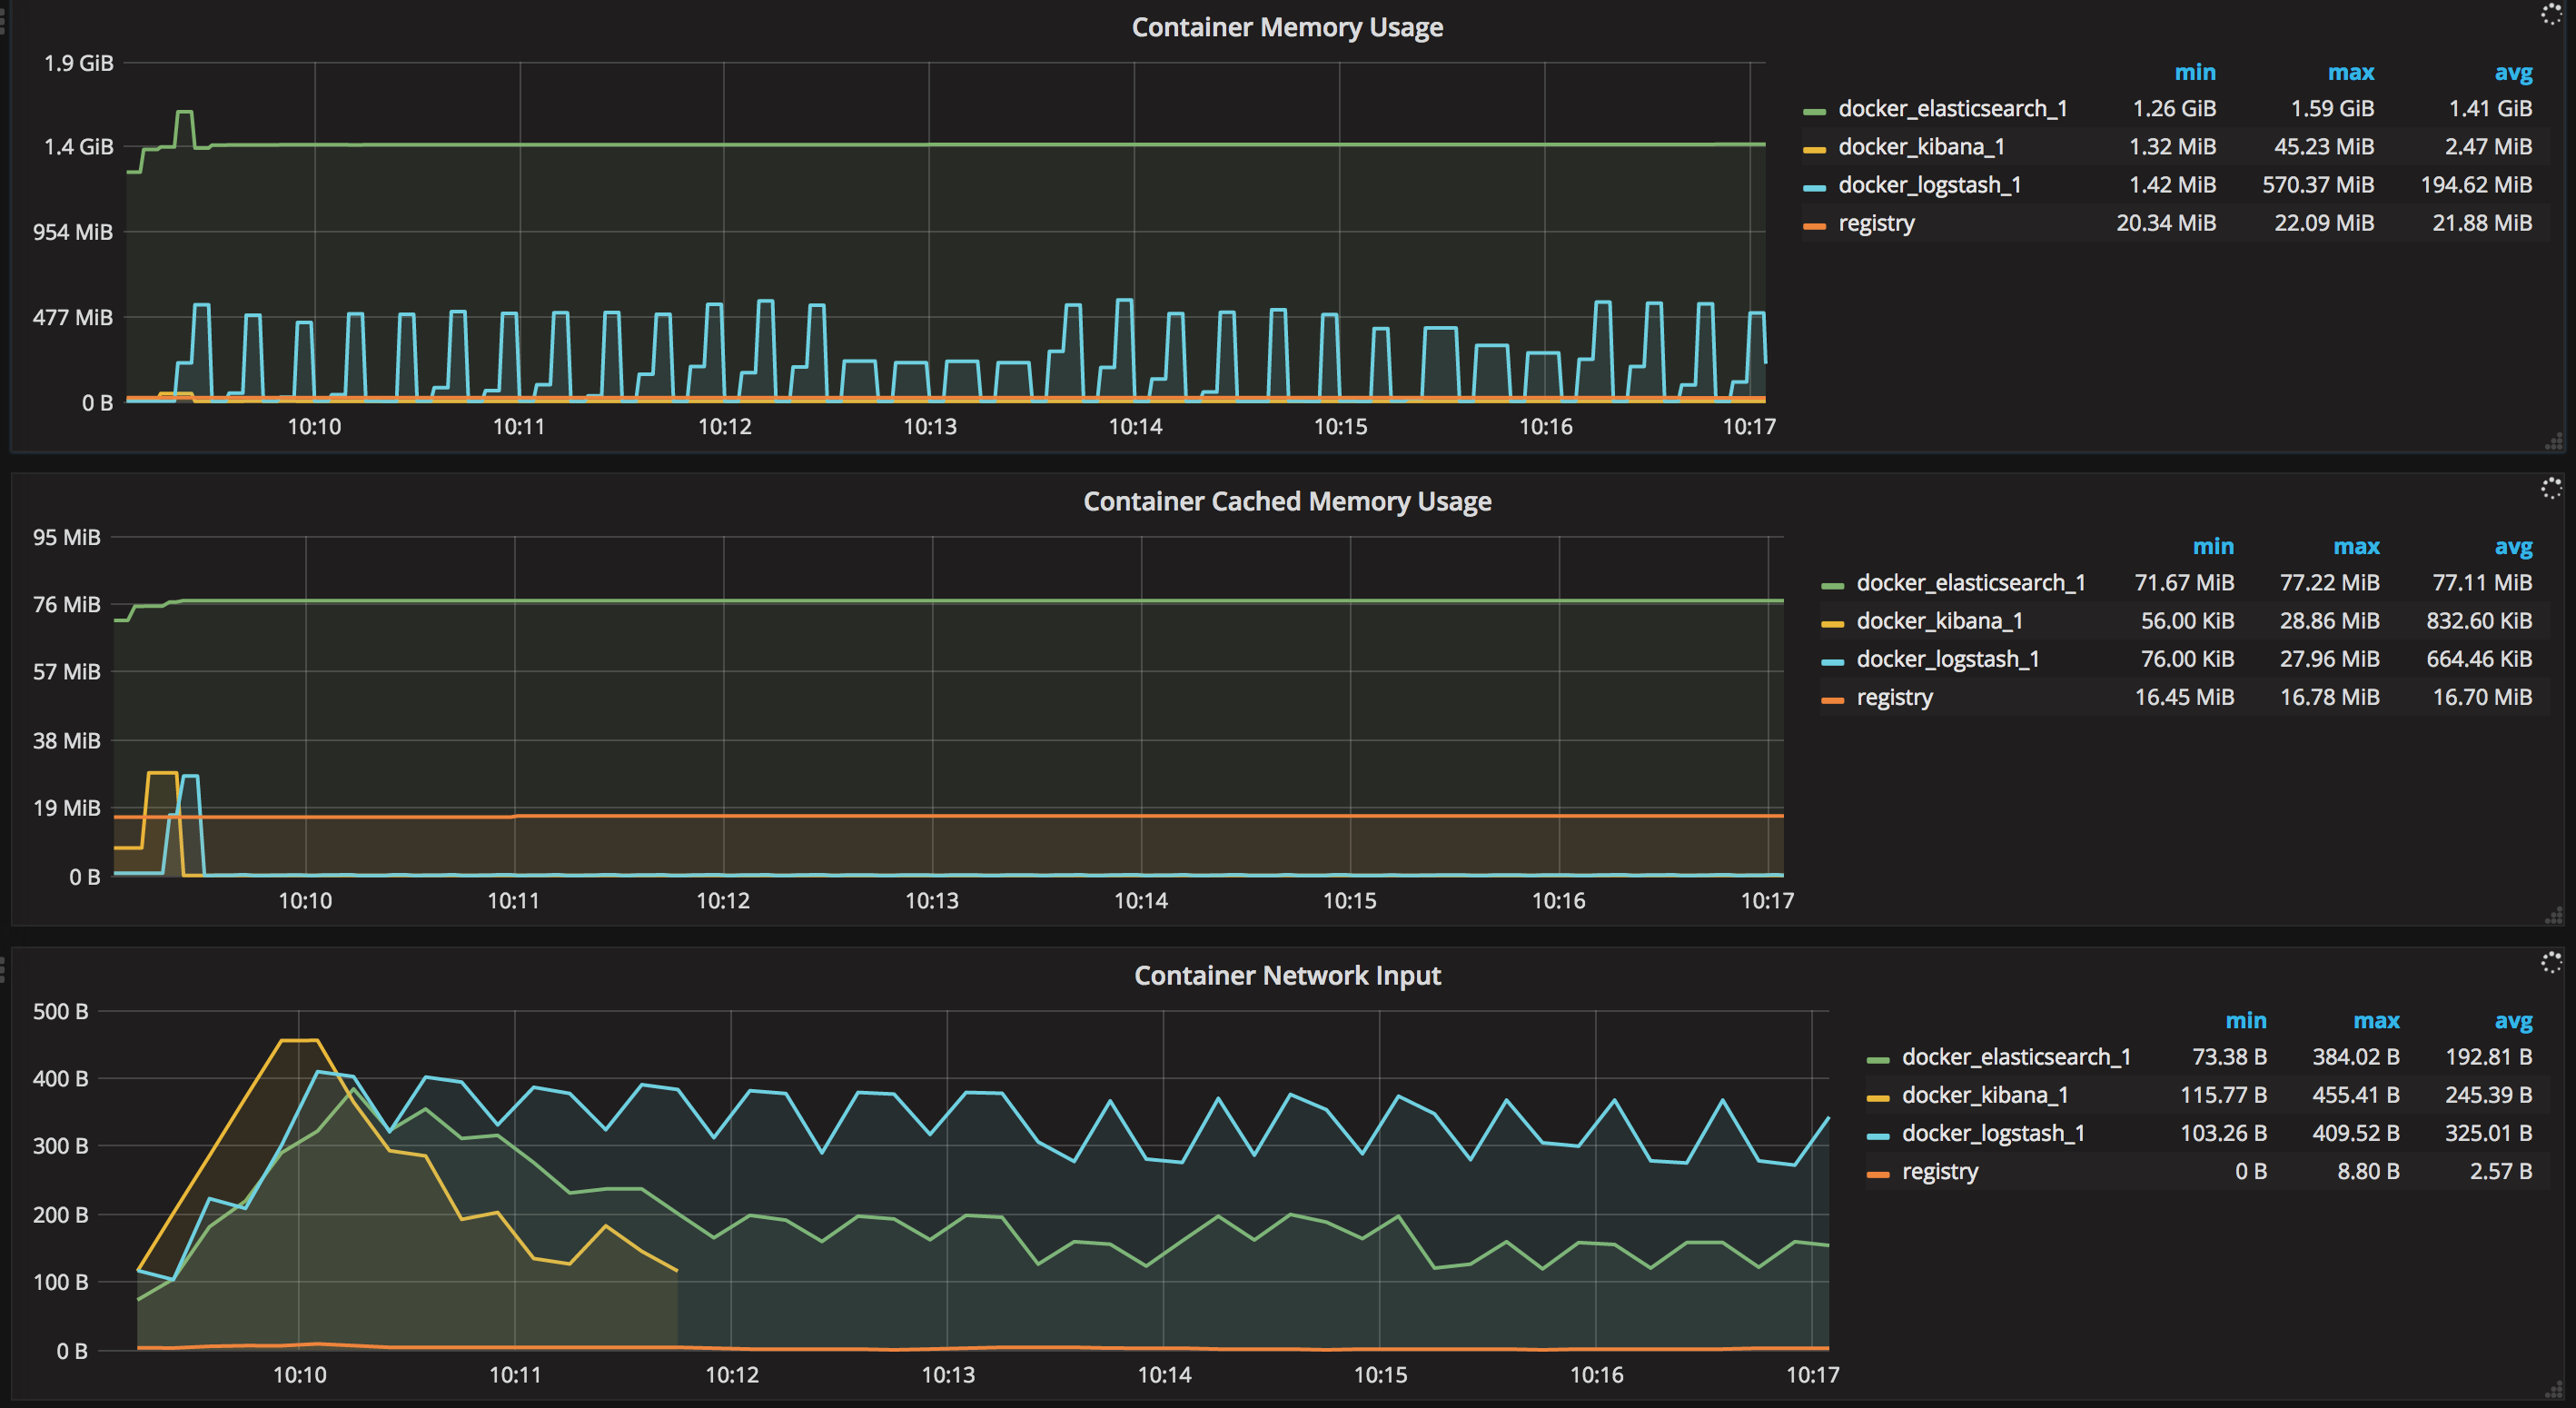
For each Container there are grapsh about
- CPU usage graph
- Memory usage graph
- Network/Inbound outbound
You can see that we only see containers that are not part of the docker compose stack we spinned up. We only see containers out of the solution, otherwise the amount of information would be overwhelming.
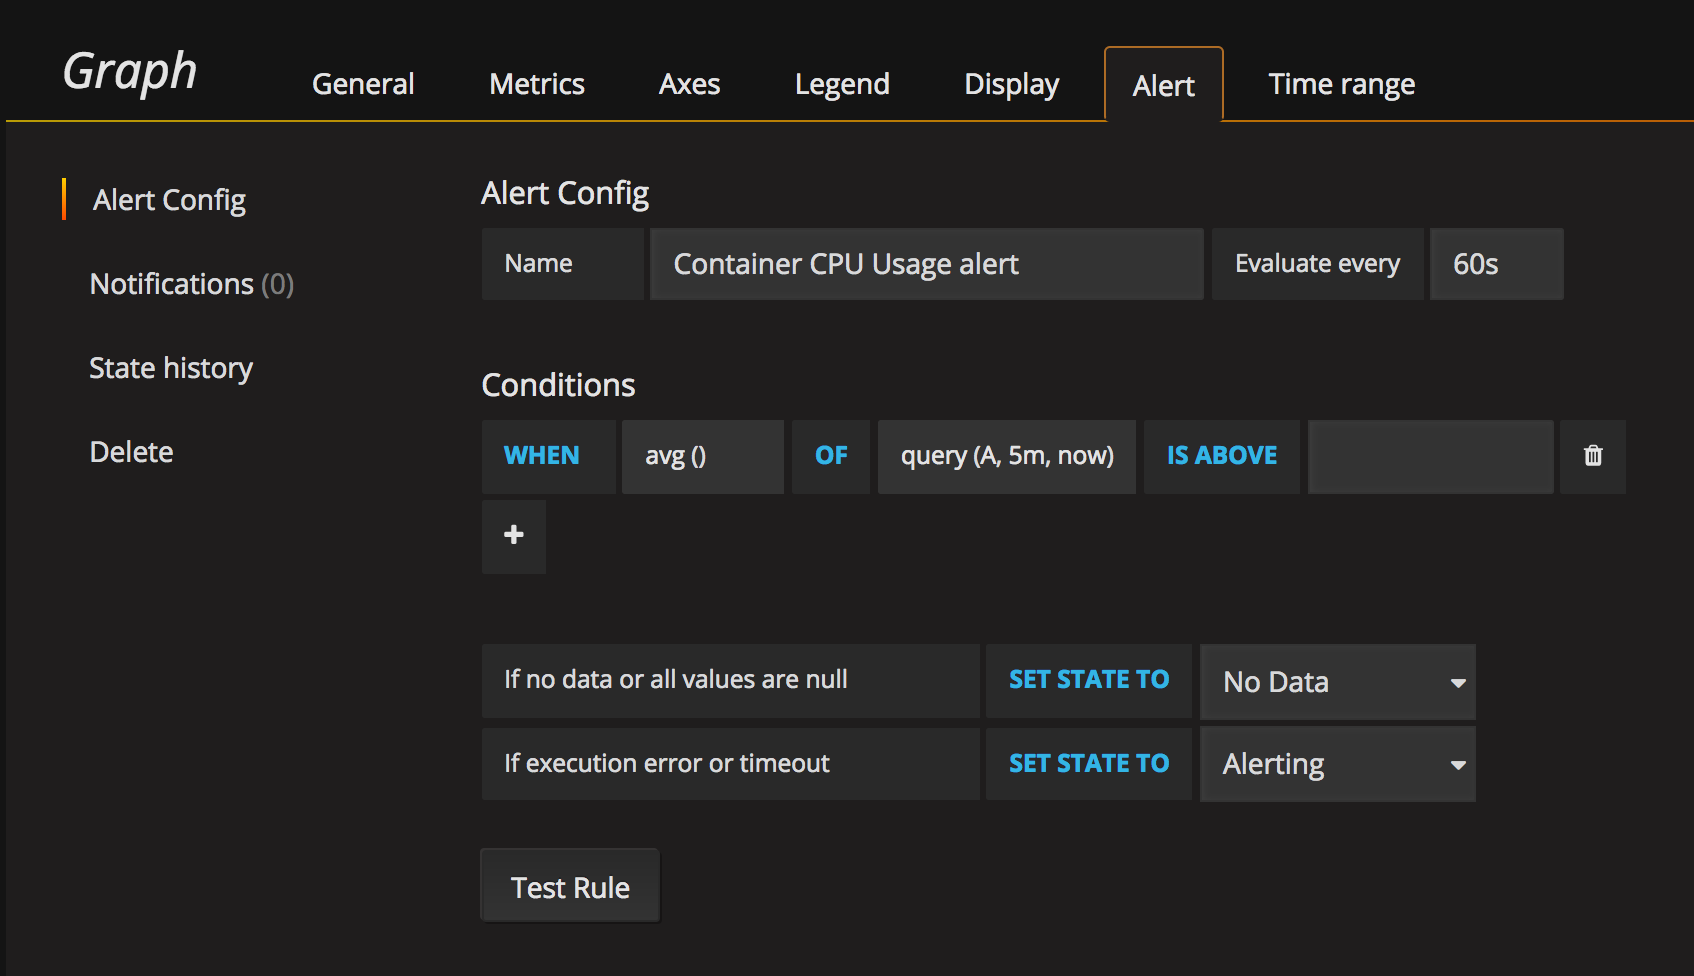
One of the main reasons to try this approach was to get notifications when values are over a specific threshold Alerts can be directly configured on a Grafana dashboard panel. Select a panel and you can browse different tabs.
3.4 Configure alerts
The main one is the Metrics which defines which is the query to use and the metrics display to use I will breakdown as an example Docker Containers / Container CPU usage panel
- Query: sum(rate(container_cpu_user_seconds_total{image!=””, container_label_org_label_schema_group!=”monitoring”}[1m]) * 100 / count_scalar(node_cpu{mode=”user”})) by (name)
- Metric Lookup: container_cpu_user_seconds_total
- General/Axis/Display: Related with how the panel is displayed
- Alerts
If you prefer to configure rules manually you can see some examples on the cloned git repository: The following examples display 3 alert rules that pinpoint several critical scenarios on a container name called “jenkins”
~/Documents/work/dockprom/prometheus(master) » cat containers.rules                                                                                            mfarache@OEL0043
ALERT jenkins_down
  IF absent(container_memory_usage_bytes{name="jenkins"})
  FOR 30s
  LABELS { severity = "critical" }
  ANNOTATIONS {
    summary= "Jenkins down",
    description= "Jenkins container is down for more than 30 seconds."
  }

 ALERT jenkins_high_cpu
  IF sum(rate(container_cpu_usage_seconds_total{name="jenkins"}[1m])) / count(node_cpu{mode="system"}) * 100 > 10
  FOR 30s
  LABELS { severity = "warning" }
  ANNOTATIONS {
    summary= "Jenkins high CPU usage",
    description= "Jenkins CPU usage is %."
  }

ALERT jenkins_high_memory
  IF sum(container_memory_usage_bytes{name="jenkins"}) > 1200000000
  FOR 30s
  LABELS { severity = "warning" }
  ANNOTATIONS {
      summary = "Jenkins high memory usage",
      description = "Jenkins memory consumption is at .",
  }%
If you want to create your own rules, just place another
curl -X POST http://<host-ip>:9090/-/reload
Final thoughts
It is really impressive how easy was to setup a local monitoring solution with barely any effort. Grafana can be integrated with multiple sources. See below for alternatives
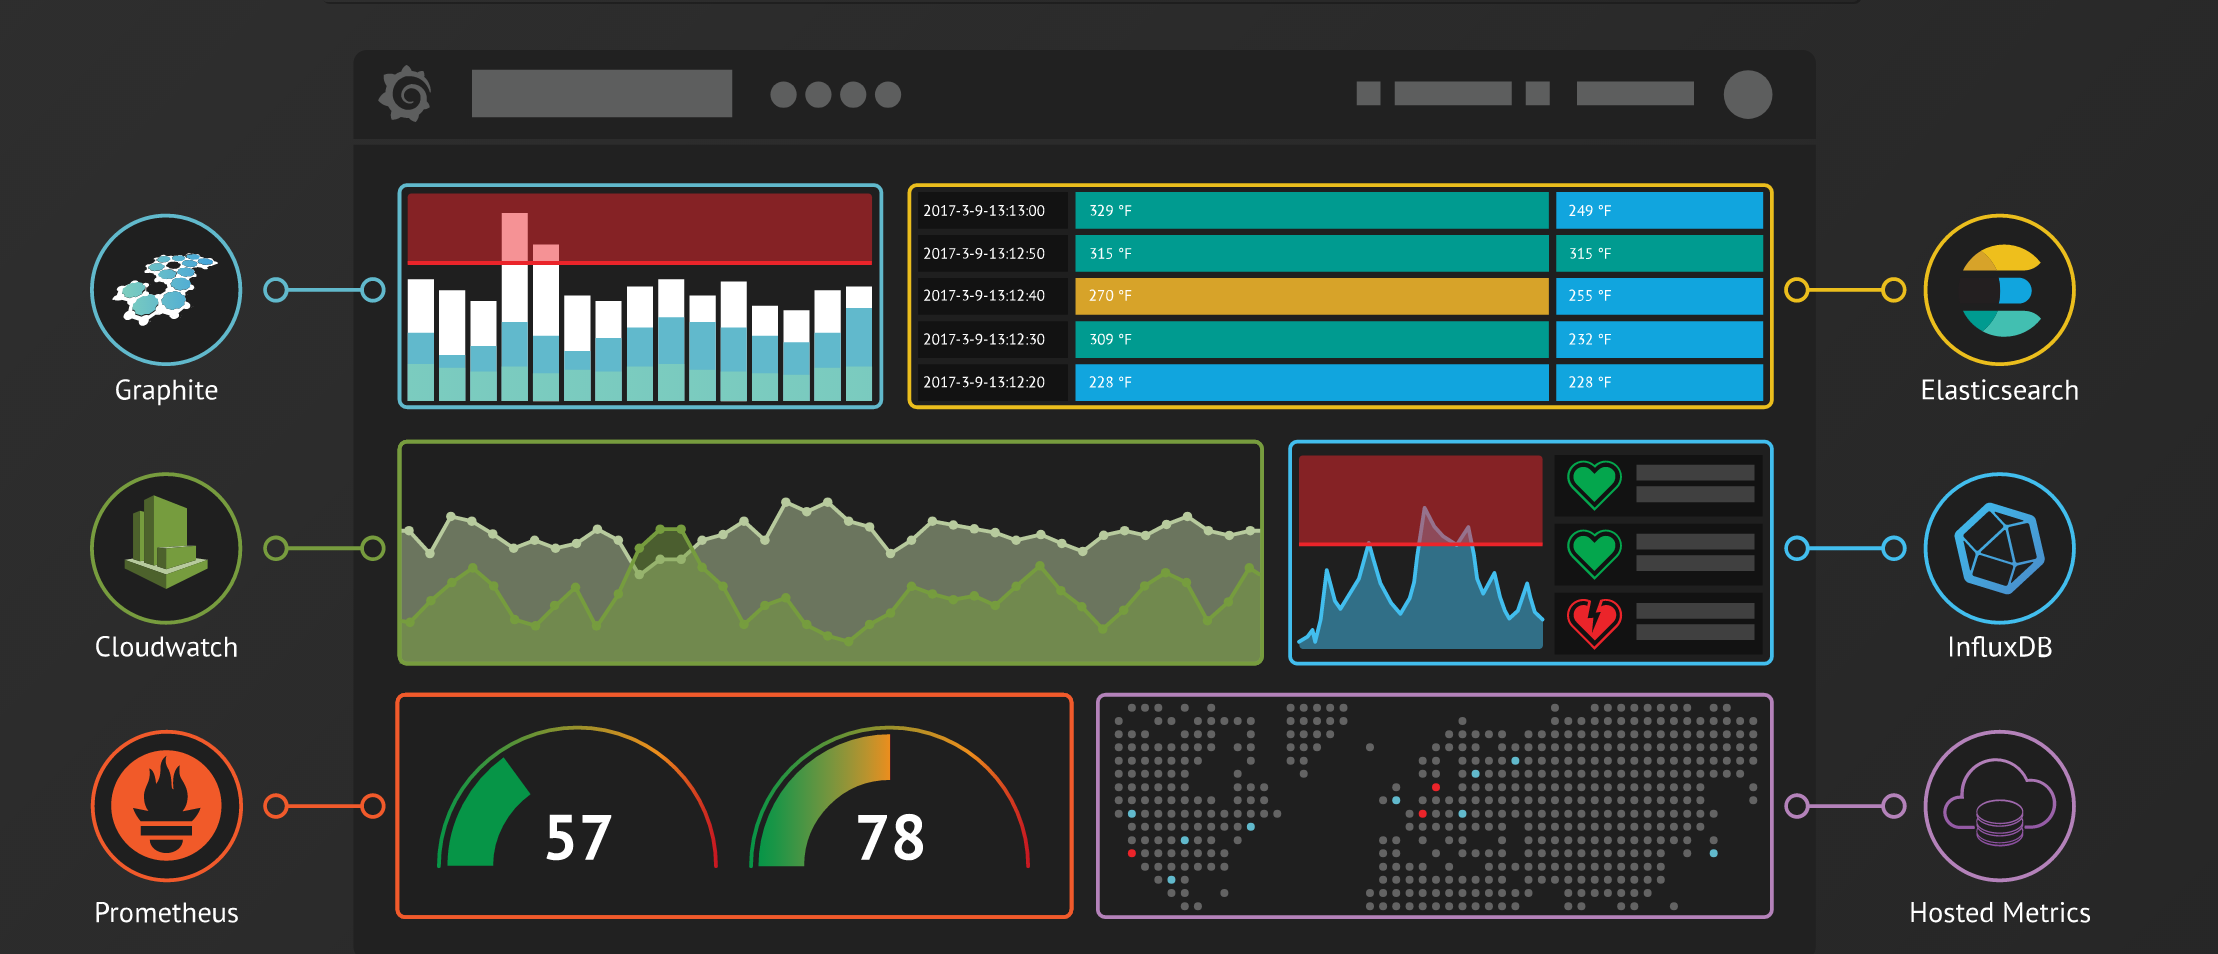
So I could imagine that if we are not happy with the Kibana (see my post on ELK stack with docker) we could even create dashboards in Grafana using ElasticSearch as a datasource!
I will let that as an exercise to the reader ;)