Log aggregation alternatives using docker - Elastic Search stack
This post is a continuation on a series of posts about using Docker to integrate our application logs. We will use ElasticSearch, Logstash and Kibana using docker-compose
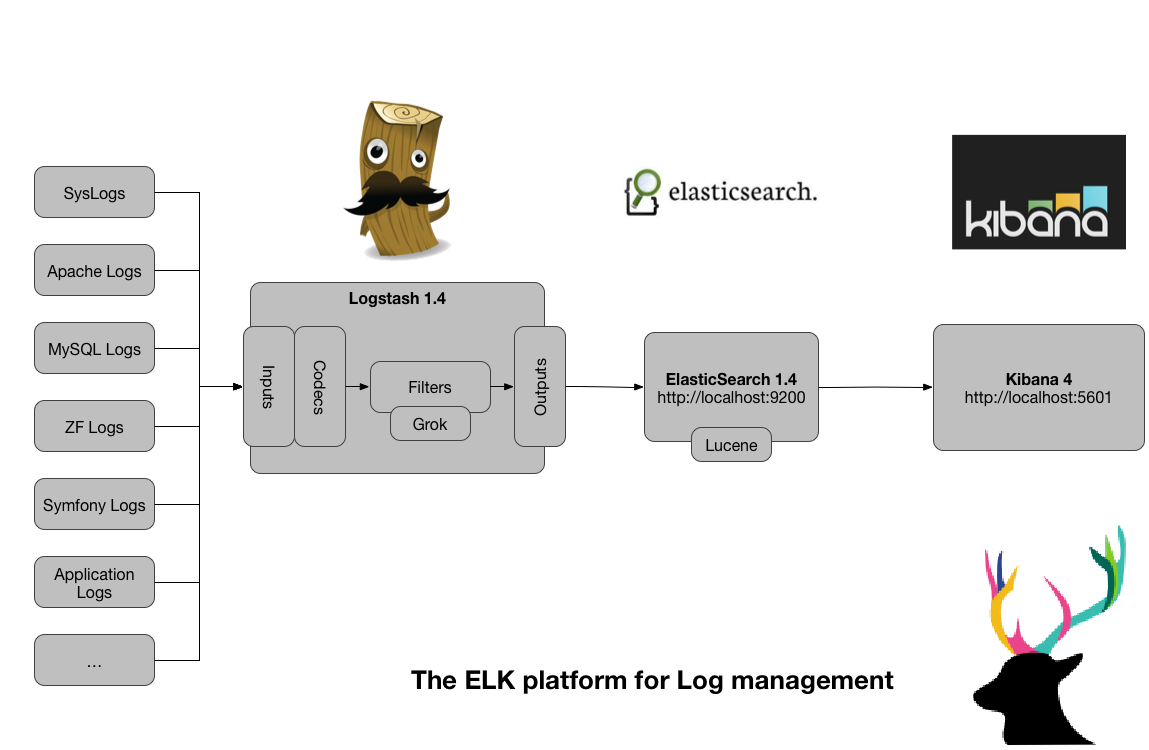
Let me introduce you to ELK
Elastic (formerly ElasticSearch) has created an end-to-end stack that delivers actionable insights in real time from almost any type of structured and unstructured data source.
ElasticSearch is been there for a while being one of the most deployed stacks for log aggregation. ElasticSearch was built from the scratch as a distributed search engine and I do not thing that alternatives like SolRCloud can reach the potential of a tool designed to be distributed from its origin.
If you do not know what ELK stands for, you better do now! …
- ELASTICSEARCH : A distributed search engine.
- LOGSTASH : Log forwarder/agregator.
- KIBANA : A nice UI source data visualization and exploration platform from Elastic that is specialized for large volumes of streaming and real-time
I hope you get the idea. Now using docker compose we can spin up ELK stack in one go.
Docker compose to the rescue
Since docker appeared I have been following many developments. It’s not only me who considers Docker as one of the tech-changers in the last years. Not only DevOps is influenced by it. I think our role as members of Development team is get the best tools to make our work more effective. Remember the old times where you have to install packages, jars, configuration files, a couple of shutdown/restart cycles? Even if you are not an old guy probably you have been there before.
With Docker compose I can now sping up 3 individual containers, in its own isolated network, with process isolation just with:
git clone https://github.com/deviantony/docker-elk
docker-compose up
That is all you need to run a basic ELK stack.
With those settings you will be able to see Kibana UI using localhost:5601. Your Logstash will be listening to receive messages in the port 5010. And ElasticSearch is the main component where we will index our log messages from our applications running in port 9200. ElasticSearch exposes a REST API that can be useful in case you need to inspect manually the collection and indexes, but we can use directly Kibana.
Note: I changed my Docker compose from the original github file to run logstash in 5010 to avoid conflicts with my local Docker Registry on 5000.
Some issues you may find in Mac Os are around mounting volumes on folders which are not shared. Review your Docker Shared Preferences on MacOs and you should be ready to go.
In the picture before you see that Logstash can feed ElasticSearch with data from multiple sources. We are interested on seeing different ways of integrating our application logs without barely any effort.
Let´s verify our ElasticSearch container is running correctly
curl http://localhost:9200/
{
name: "FUrjxjY",
cluster_name: "docker-cluster",
cluster_uuid: "sns_eCqPRraMDmoVnCQ1Lw",
version: {
number: "5.3.0",
build_hash: "3adb13b",
build_date: "2017-03-23T03:31:50.652Z",
build_snapshot: false,
lucene_version: "6.4.1"
},
tagline: "You Know, for Search"
}
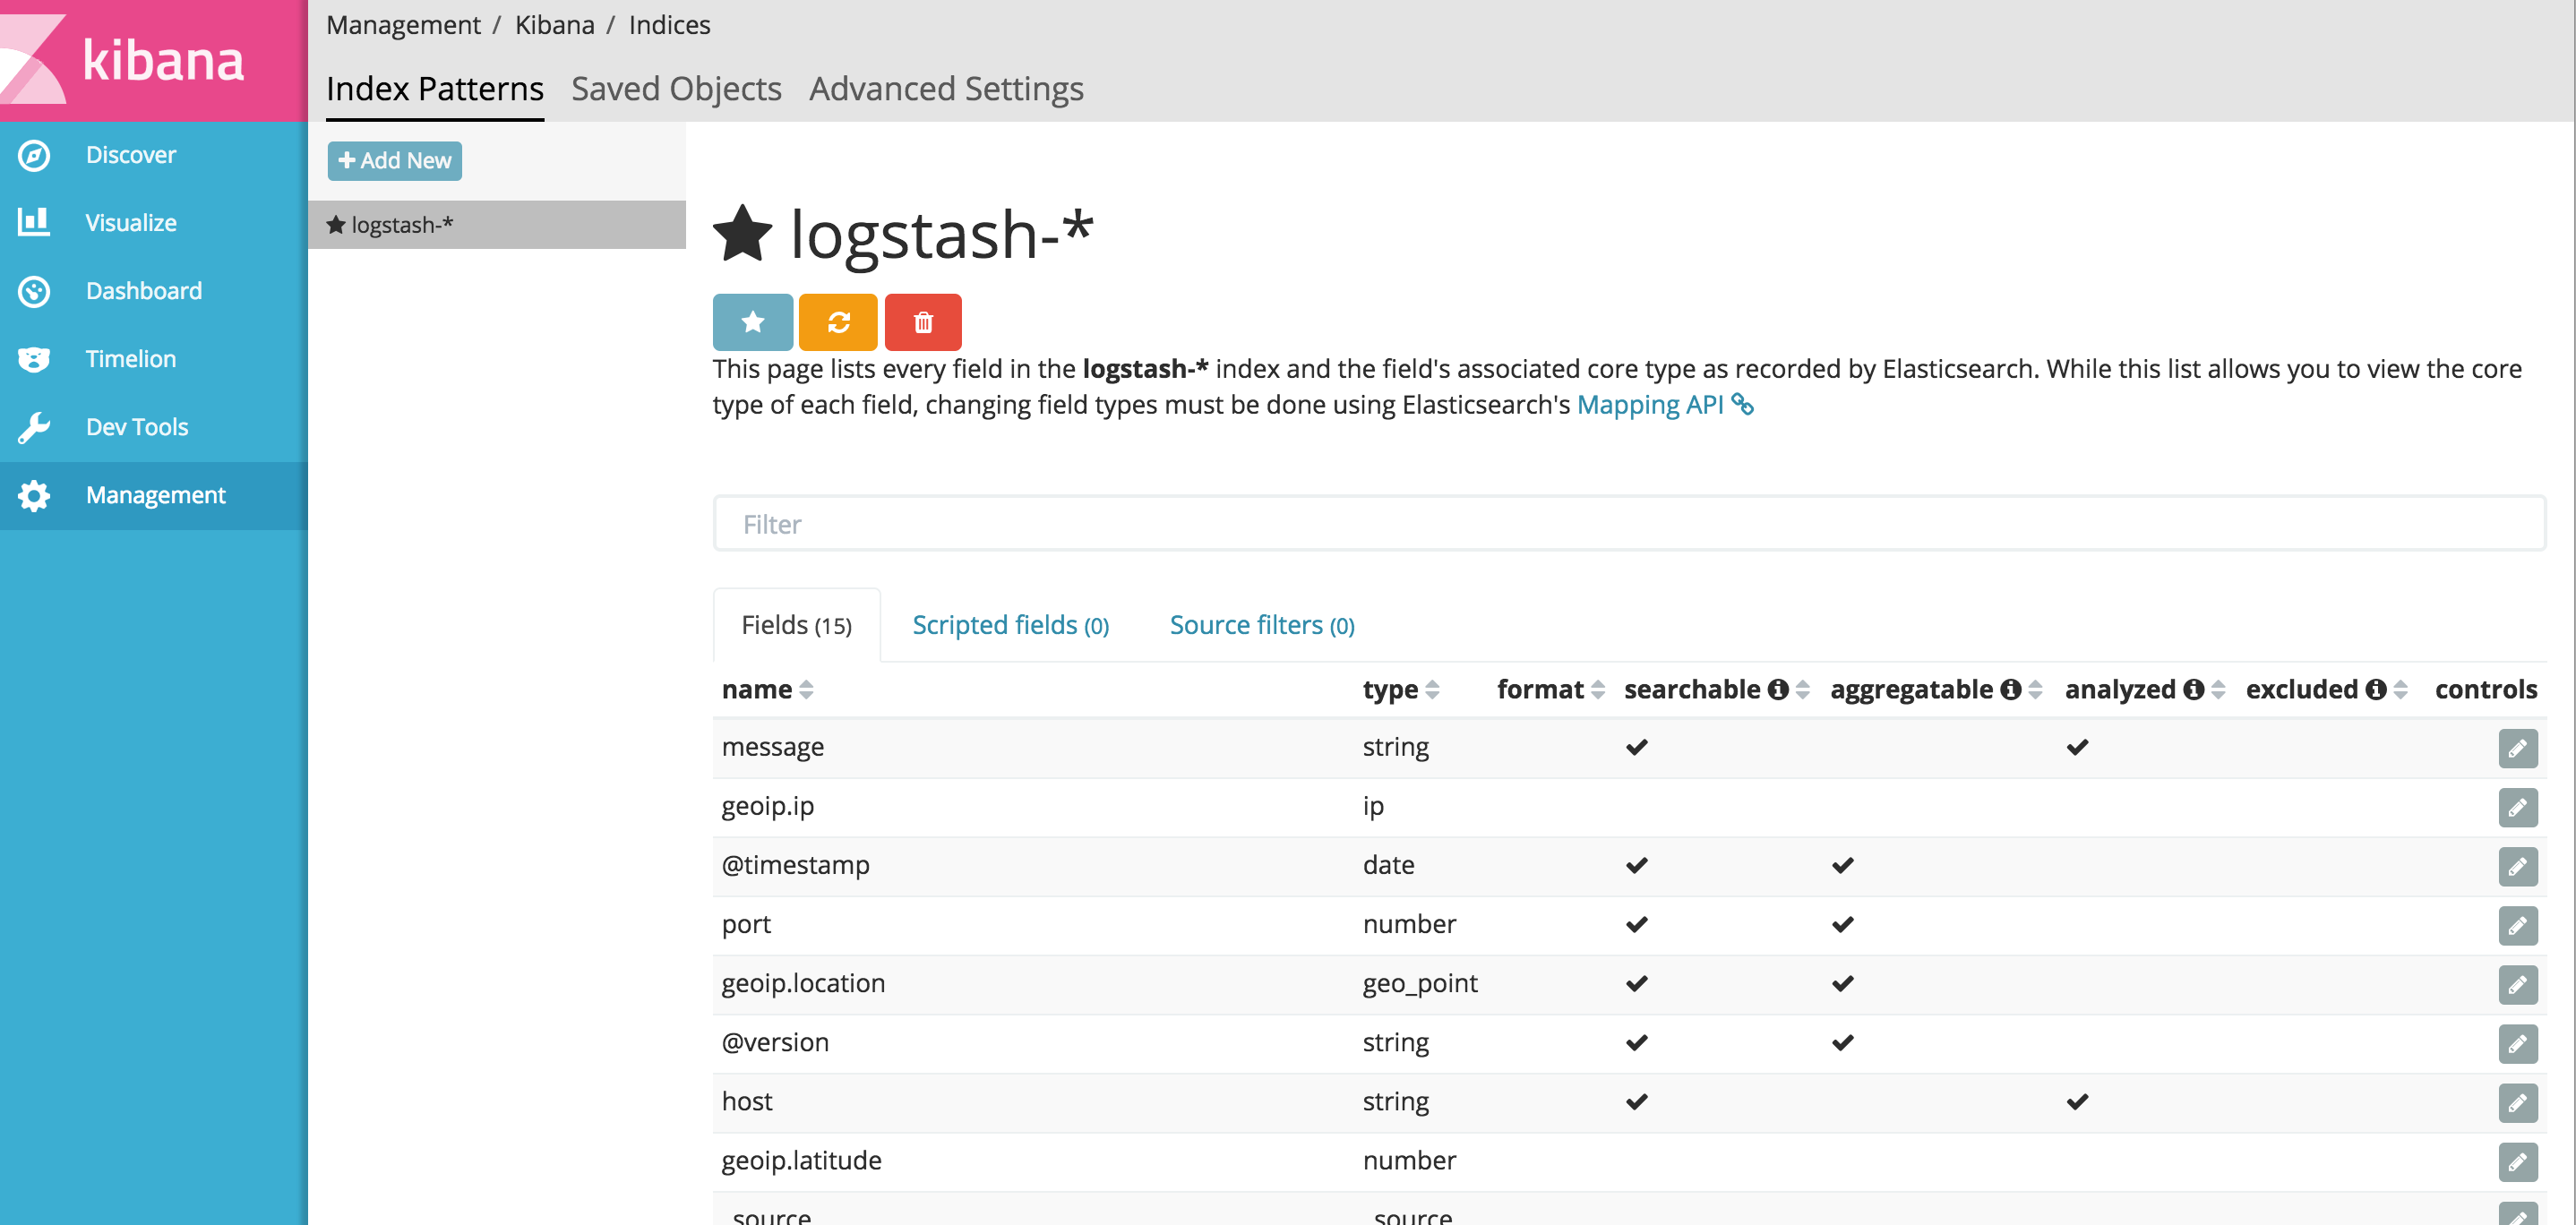
Before you do anything, just add a new index , Go to your Kibana console (http://localhost:5601) and accept the default one (logstash) so Kibana knows where to look at within the possible multiple collections you have stored in ElasticSearch.
There other several alternatives to send information to Logstash. First lets see that end to end all my components work.
| echo “My first awesome message” | nc localhost 5010 |
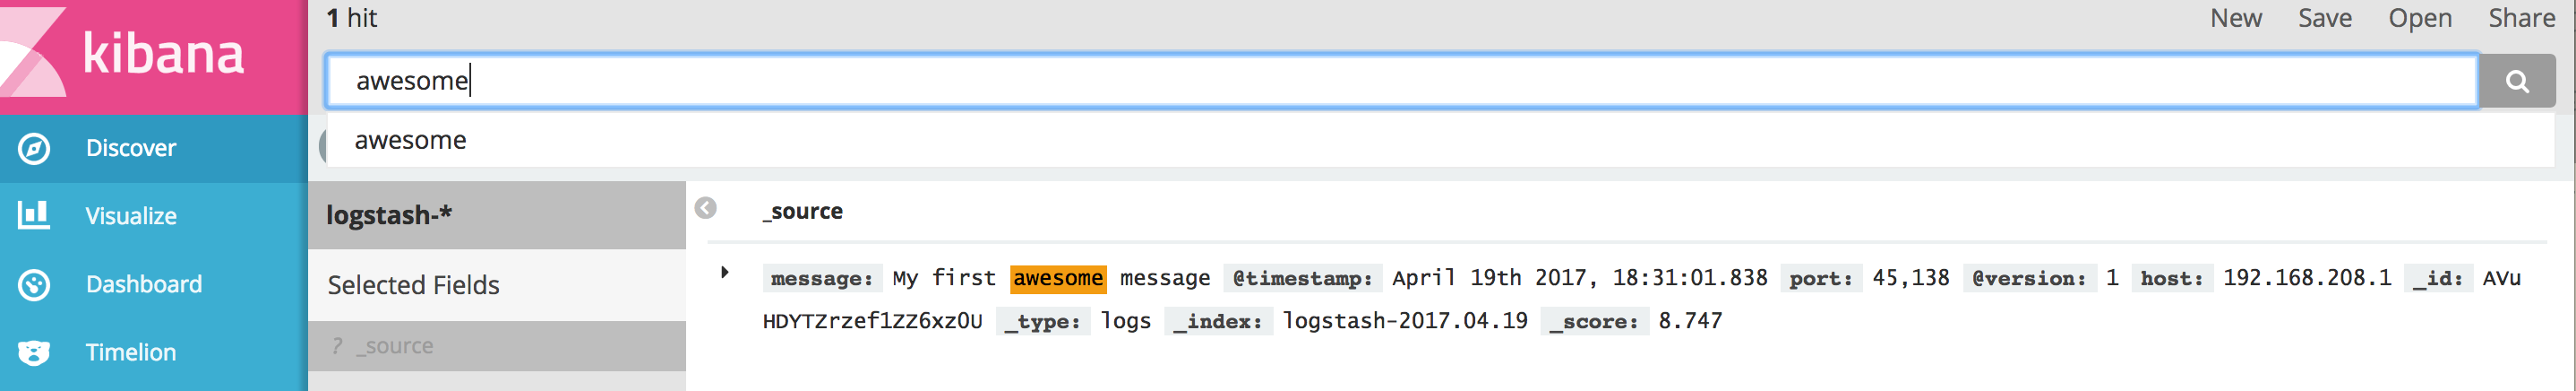
Great!
So we could just apply a “poor’s man” solution, combining with some bash scripting and some logging policy we could schedule to send a set of files to logstash
cat logfile.log | nc localhost 5010
Or you can even do it on a live tail stream
tail -f logfile.log | nc localhost 5010
But let´s see now how can we do integrate our application in a different way. Let´s send just the log lines across the wire network. And we can do that as part of our logging configuration.
We need to do is to be sure that our logging frameworks has a logging appender to send the logs into Logstash Using log4j is pretty simple
log4j.rootLogger=INFO,logstash
...
log4j.appender.logstash=org.apache.log4j.net.SocketAppender
log4j.appender.logstash.port=12201
log4j.appender.logstash.remoteHost=127.0.0.1
However in my case we use logback so this is the definition of the appender within my logback.xml file adding a socket appender and send the log entries via the 5000 TCP port exposed by Logstash.
<?xml version="1.0" encoding="UTF-8"?>

<configuration>
	<appender name="stash" class="ch.qos.logback.classic.net.SocketAppender">
		<remoteHost>localhost</remoteHost>
		<port>5010</port>
	</appender>
	<appender name="STDOUT" class="ch.qos.logback.core.ConsoleAppender">
		<encoder>
			<pattern>%d{HH:mm:ss.SSS} [%thread] %-5level %logger{36} - %msg%n
			</pattern>
		</encoder>
	</appender>


	<!-- Setting the root level of logging -->
	<root level="info">
		<appender-ref ref="stash" />
	</root>
</configuration>
Now I run my application (in my case our Arquillian suite test ) and all the messages should be there. Neat right?
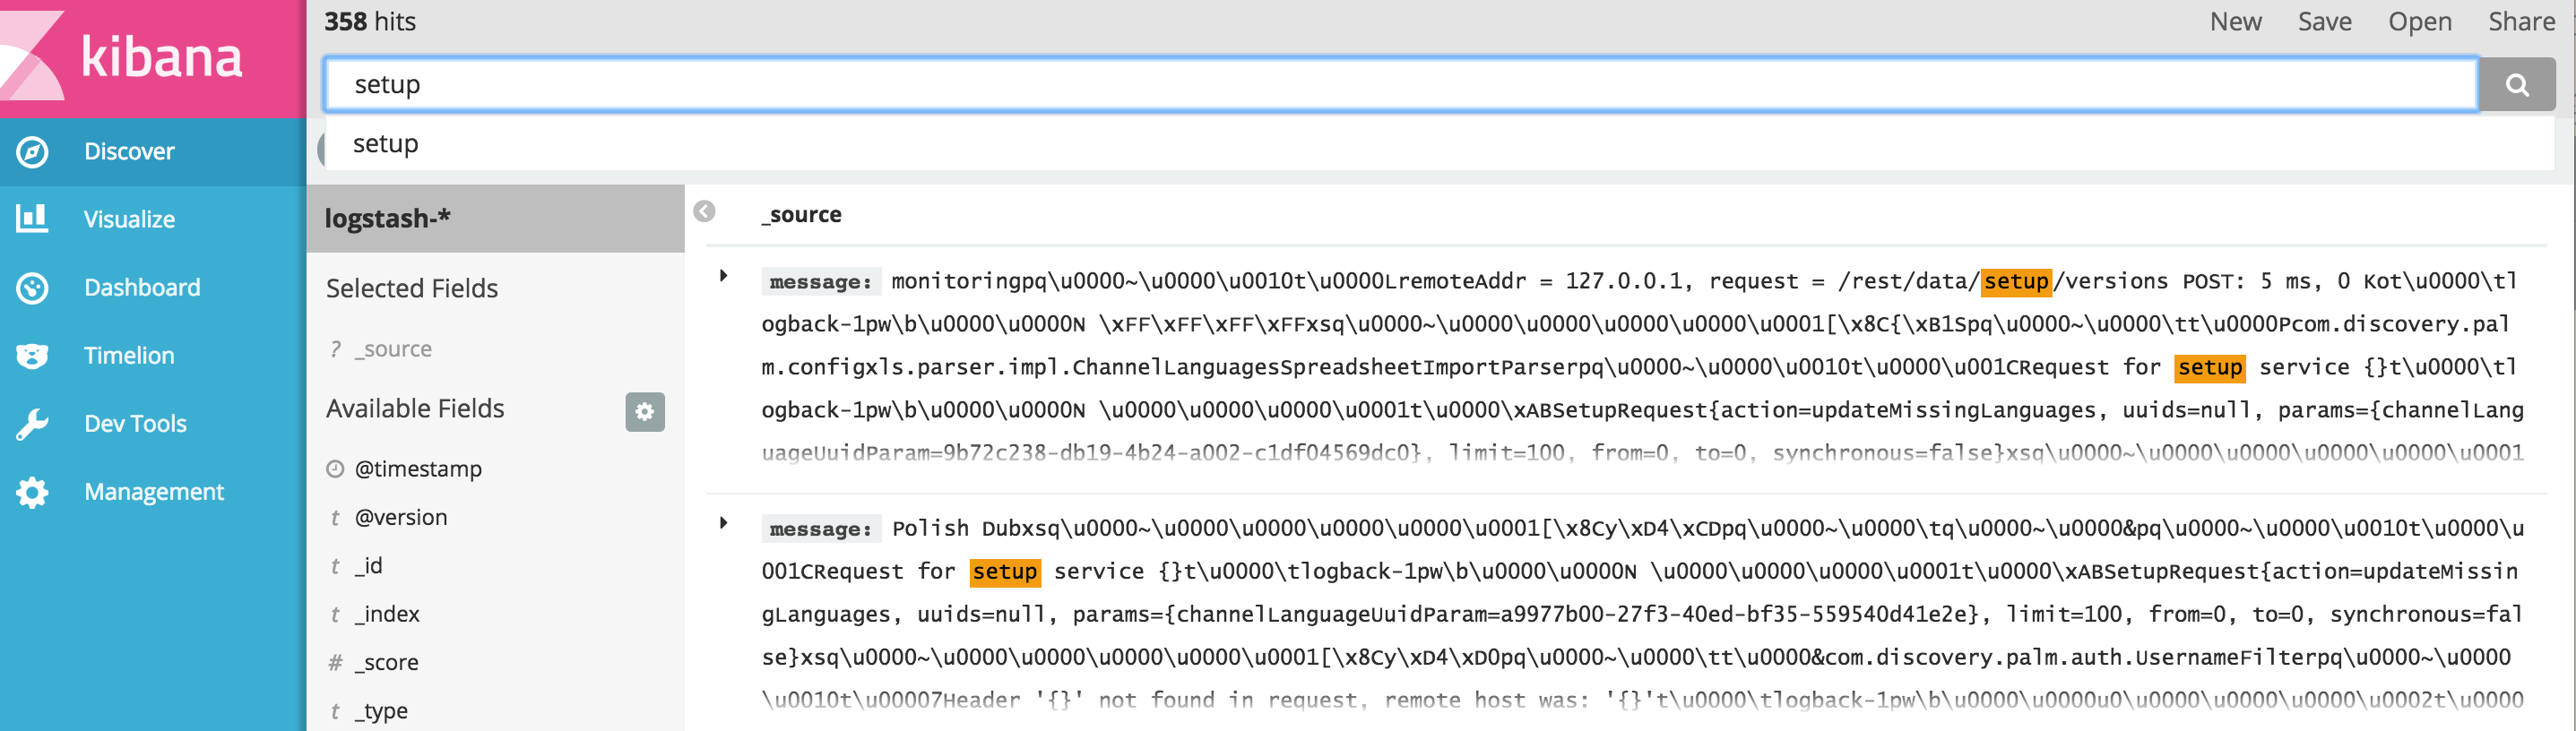
We have a little issue, seems our SocketAppender is sending weird escape characters for space and tabs that pollute our output.
[TO BE CONTINUED…]
Final Thoughts
There is no reason why we cannot use ELK stack in our own DEV environment and if we were in charge fully of the customer infrastructure I would recommend to replace Splunk due to the cost of the licensing.