Docker toolset to inspect your containers Sen, Portainer and caDvisor
A very short post showing some tools that can help you managing your docker containers in a intuitive way. We will see a terminal management tool, a nice web UI Portainer and a monitoring tool: caAdvisor from Google.
Hacking docker with terminal console
I stumbled with this term console that with you can manage your container and images. You can stop/start, see all the layers used and sizes and see the output of the log files.
For those who are lazy not to type docker logs -f “containername” , the console gives you basic insigths on the state of your containers. In MacOs I could not see the bar graphs indicators of CPU and memory resources.. but still is a nice tool to have around
docker run -v /var/run/docker.sock:/run/docker.sock -ti -e TERM tomastomecek/sen

A full list of features in action can be seen here https://github.com/TomasTomecek/sen/blob/master/docs/features.md
Portainer
If you do not fancy term style management you can use Portainer, which offers an awesome UI experience and a lot of interesting features out of the box. Provides you access to a docker host or a swarm cluster.
They provide a demo site so you interact with the tool without using their docker container Visit http://demo.portainer.io/ with credentials: “admin” / “tryportainer”.
Running in your laptop is as easy as
~/Documents/work/mfarache(master*) » docker run -d -p 9000:9000 -v /var/run/docker.sock:/var/run/docker.sock portainer/portainer
ab241b8625d9c679d1e6dd2cf4086843a89ac263cdafe33ed09a9f0a9391bc07
The first time you need to provide a password for the user admin.
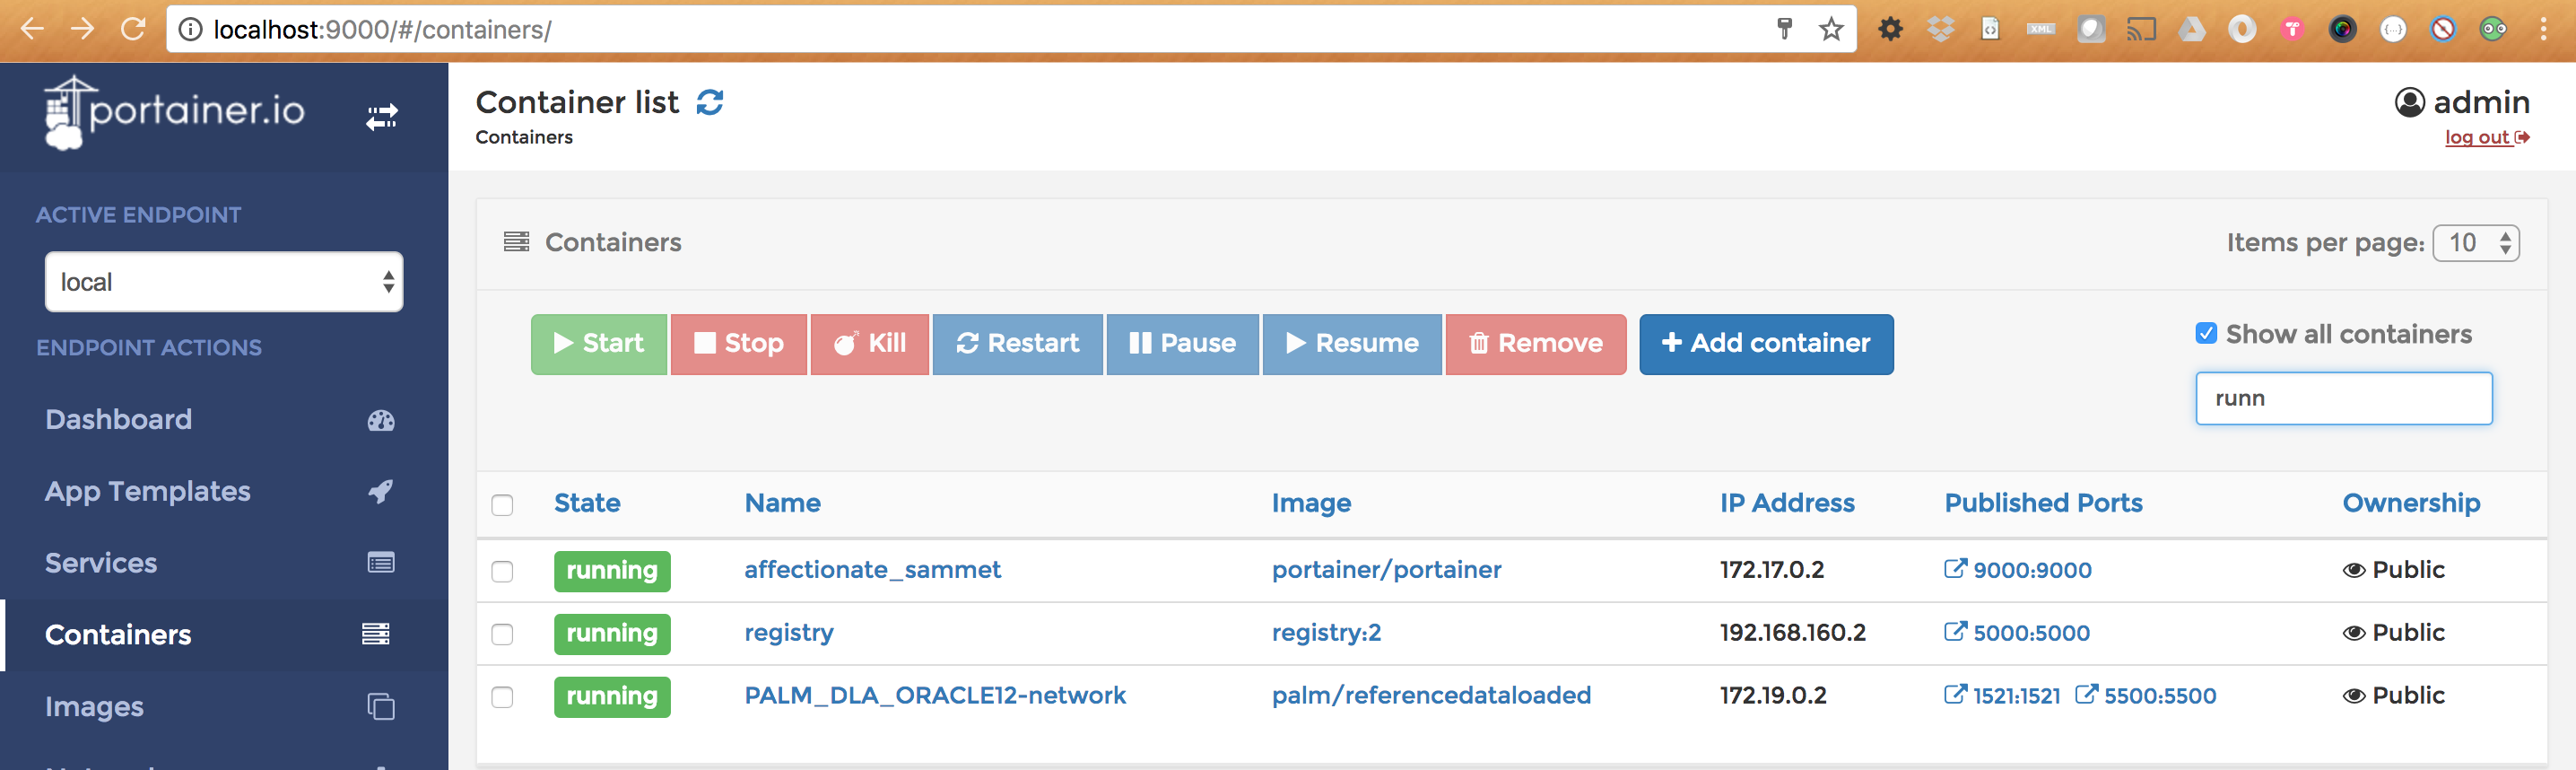
One you get in, you can see the list of containers with its state , and you can perform actions on them to remove them, stop them or restart them. I typed Running in the filter box to remove the noise of stopped/unused containers.
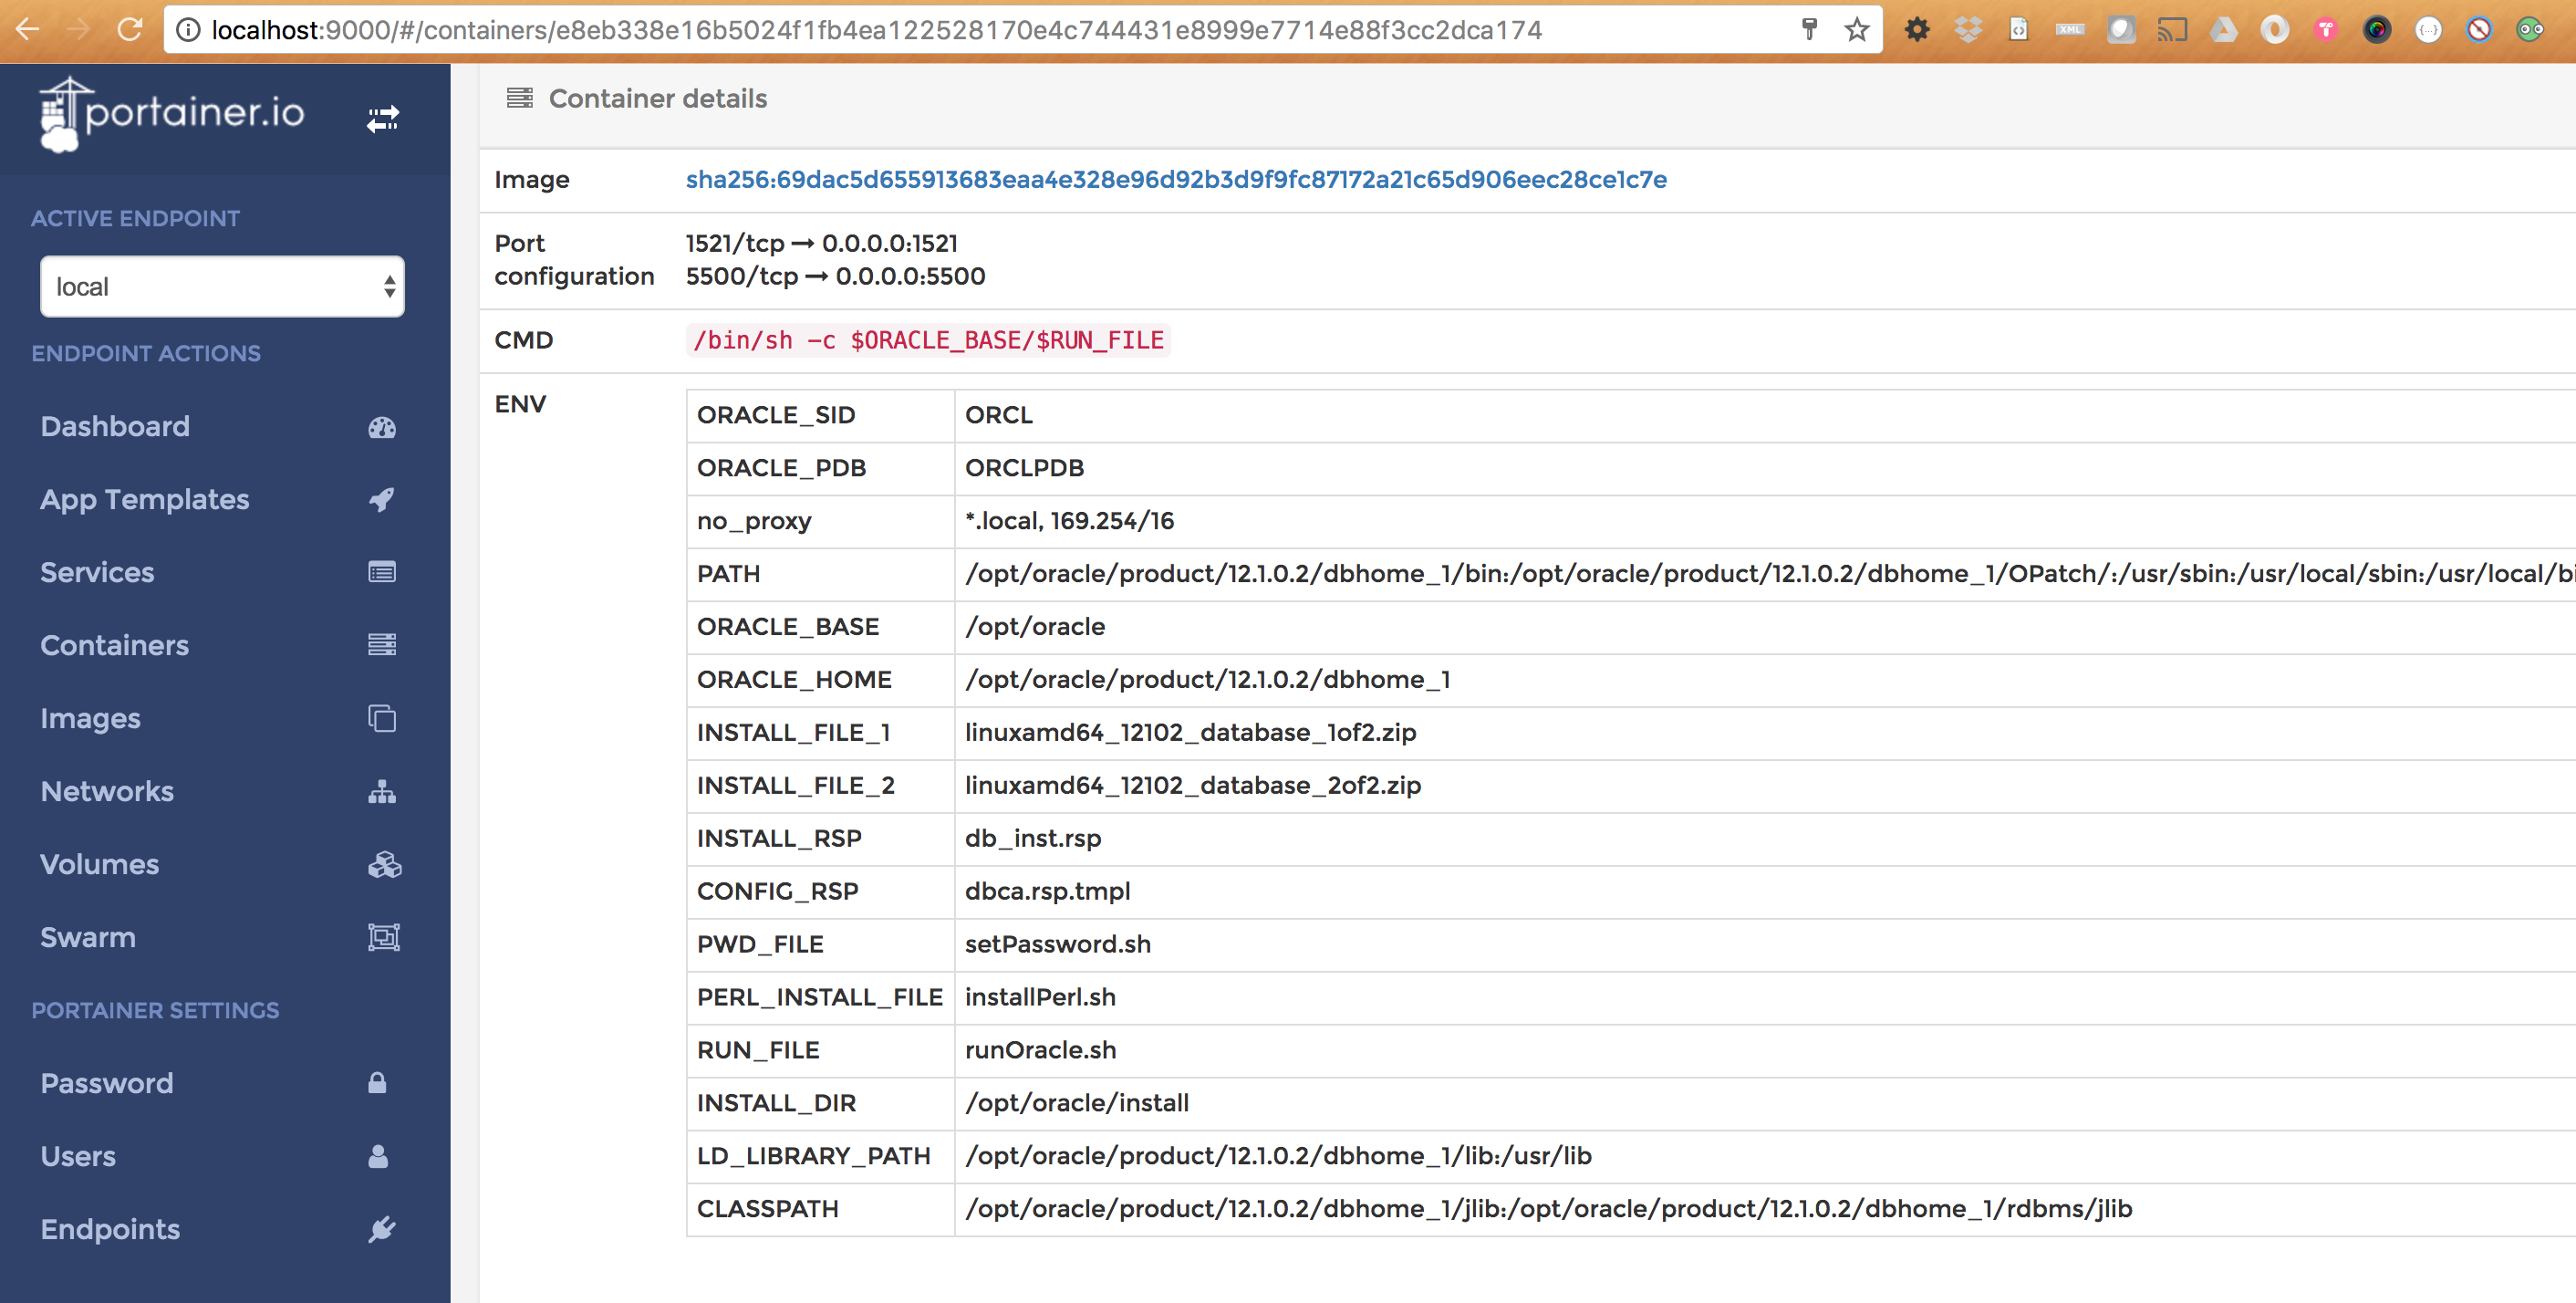
Let´s pick my Oracle12 container instance. Once you select a container you can see details about the containers like the command launched to execute it, which are the environment variables, the ports exposed, volumen and network information,etc.
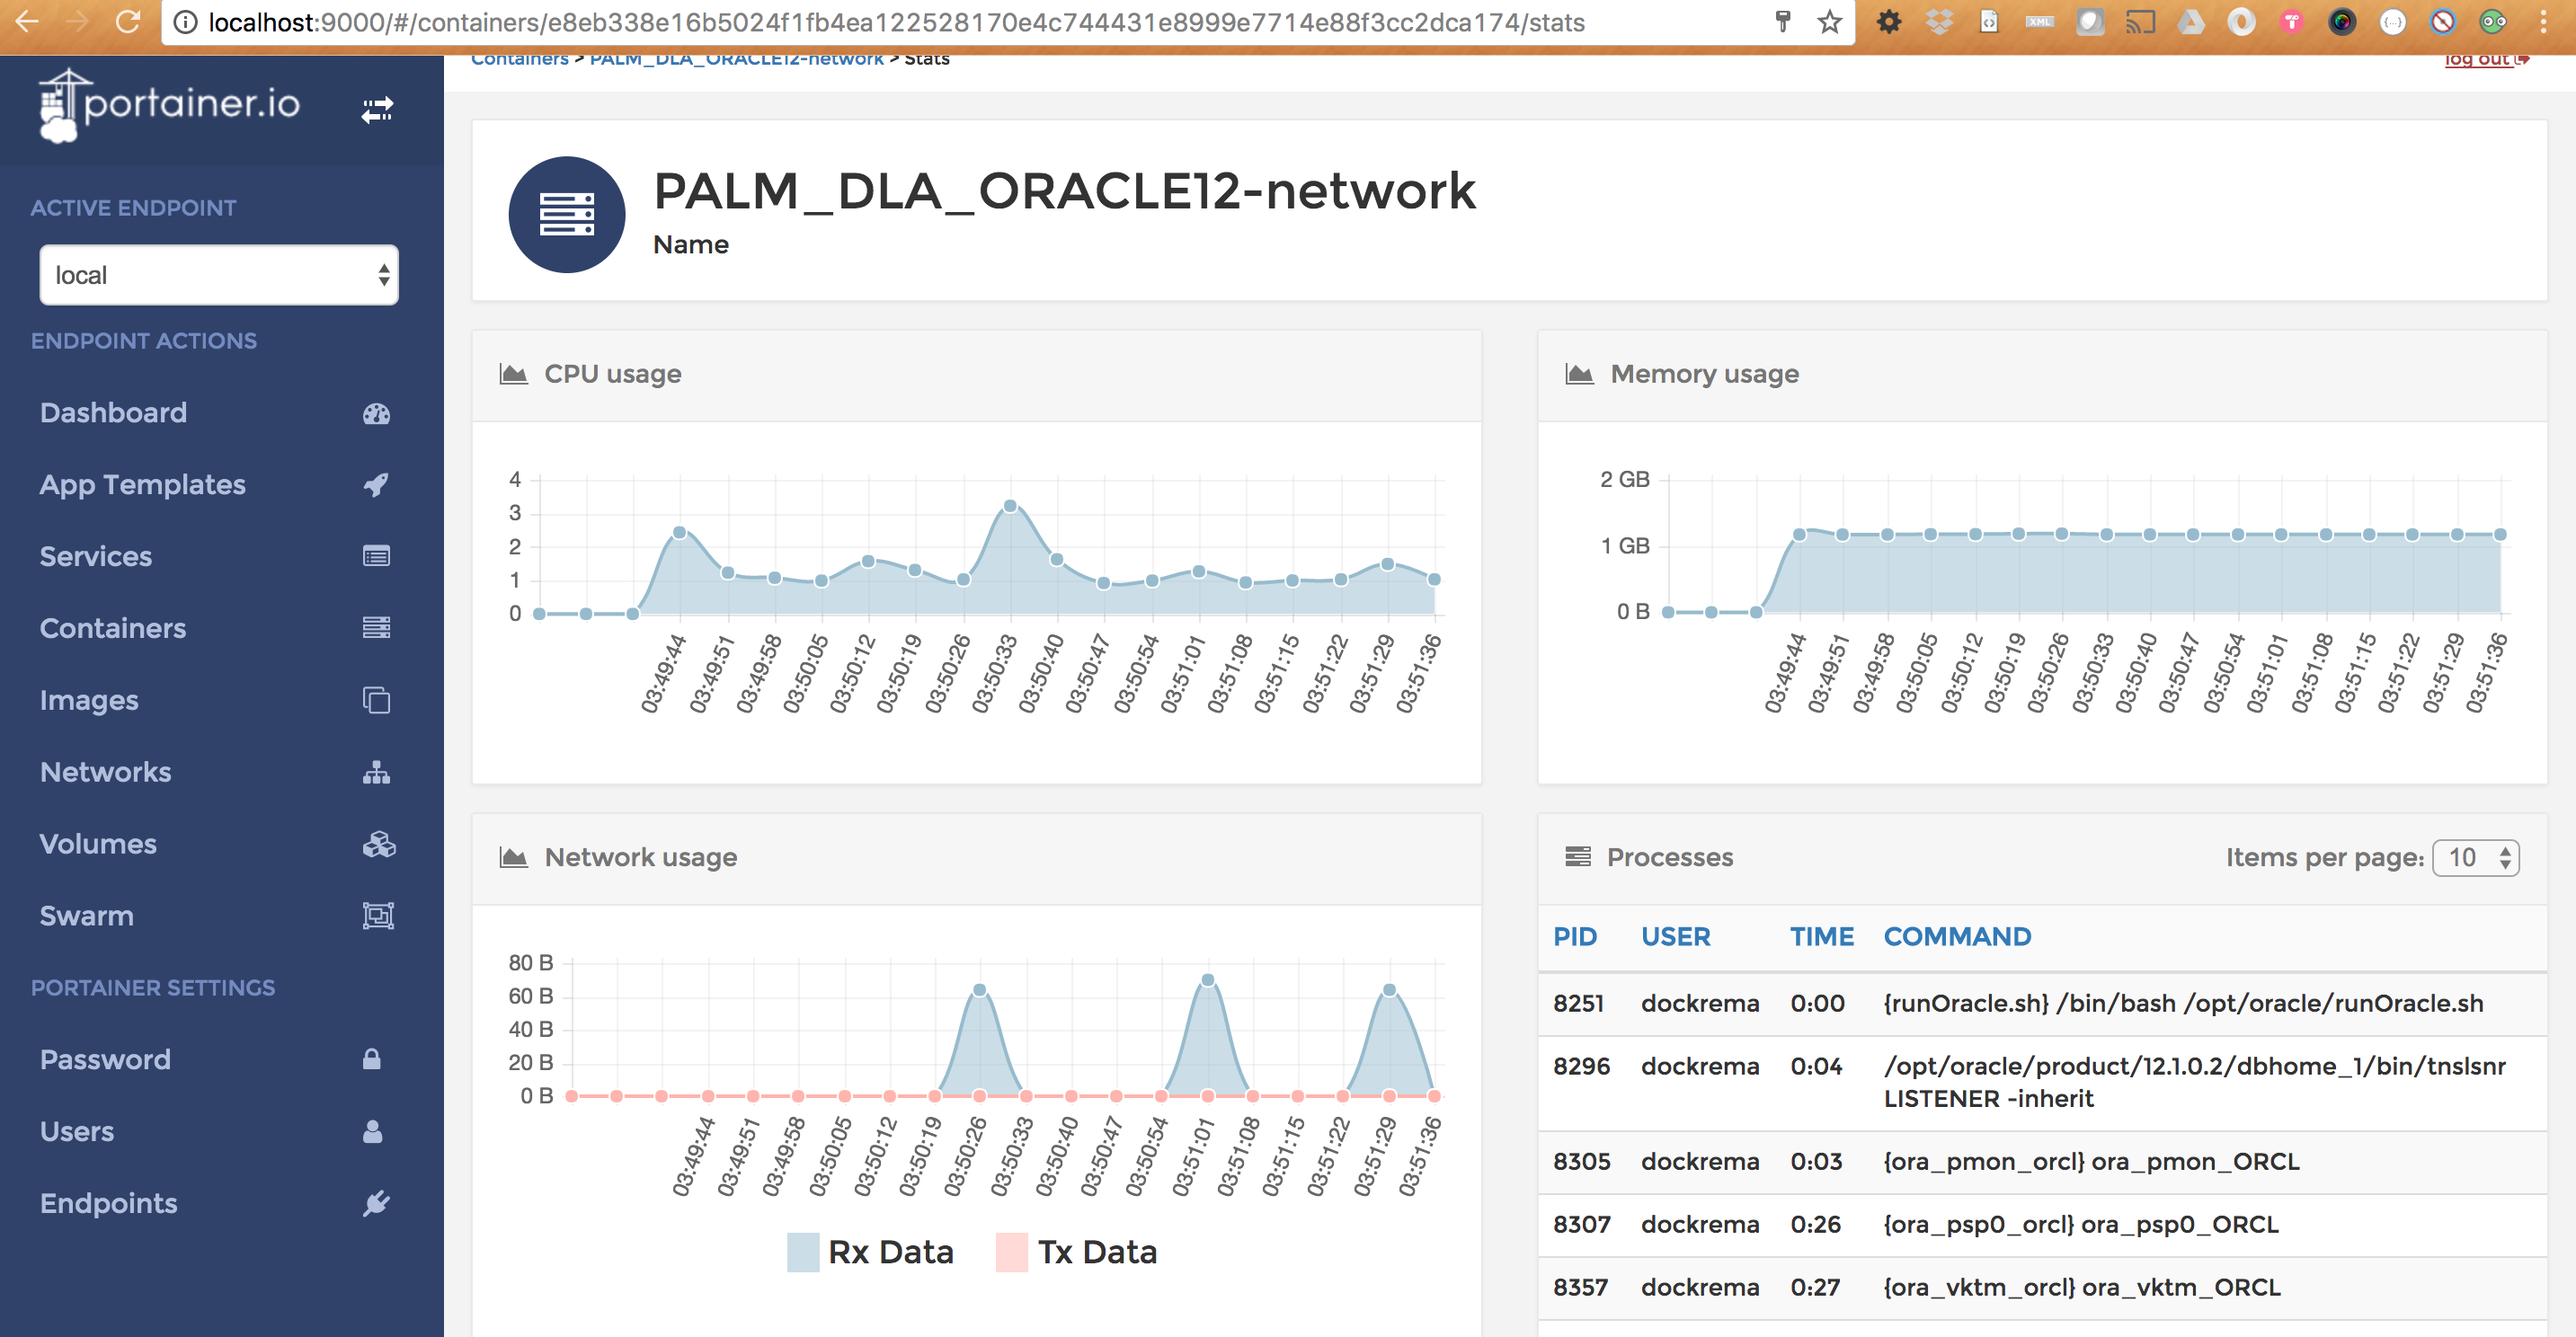
You can also see basic cpu and memory stats for each container. The information is not comparable with the one we can get with Grafana was seen in previous post, but is a nice overview in case you want to have a sneak peek of your containers.
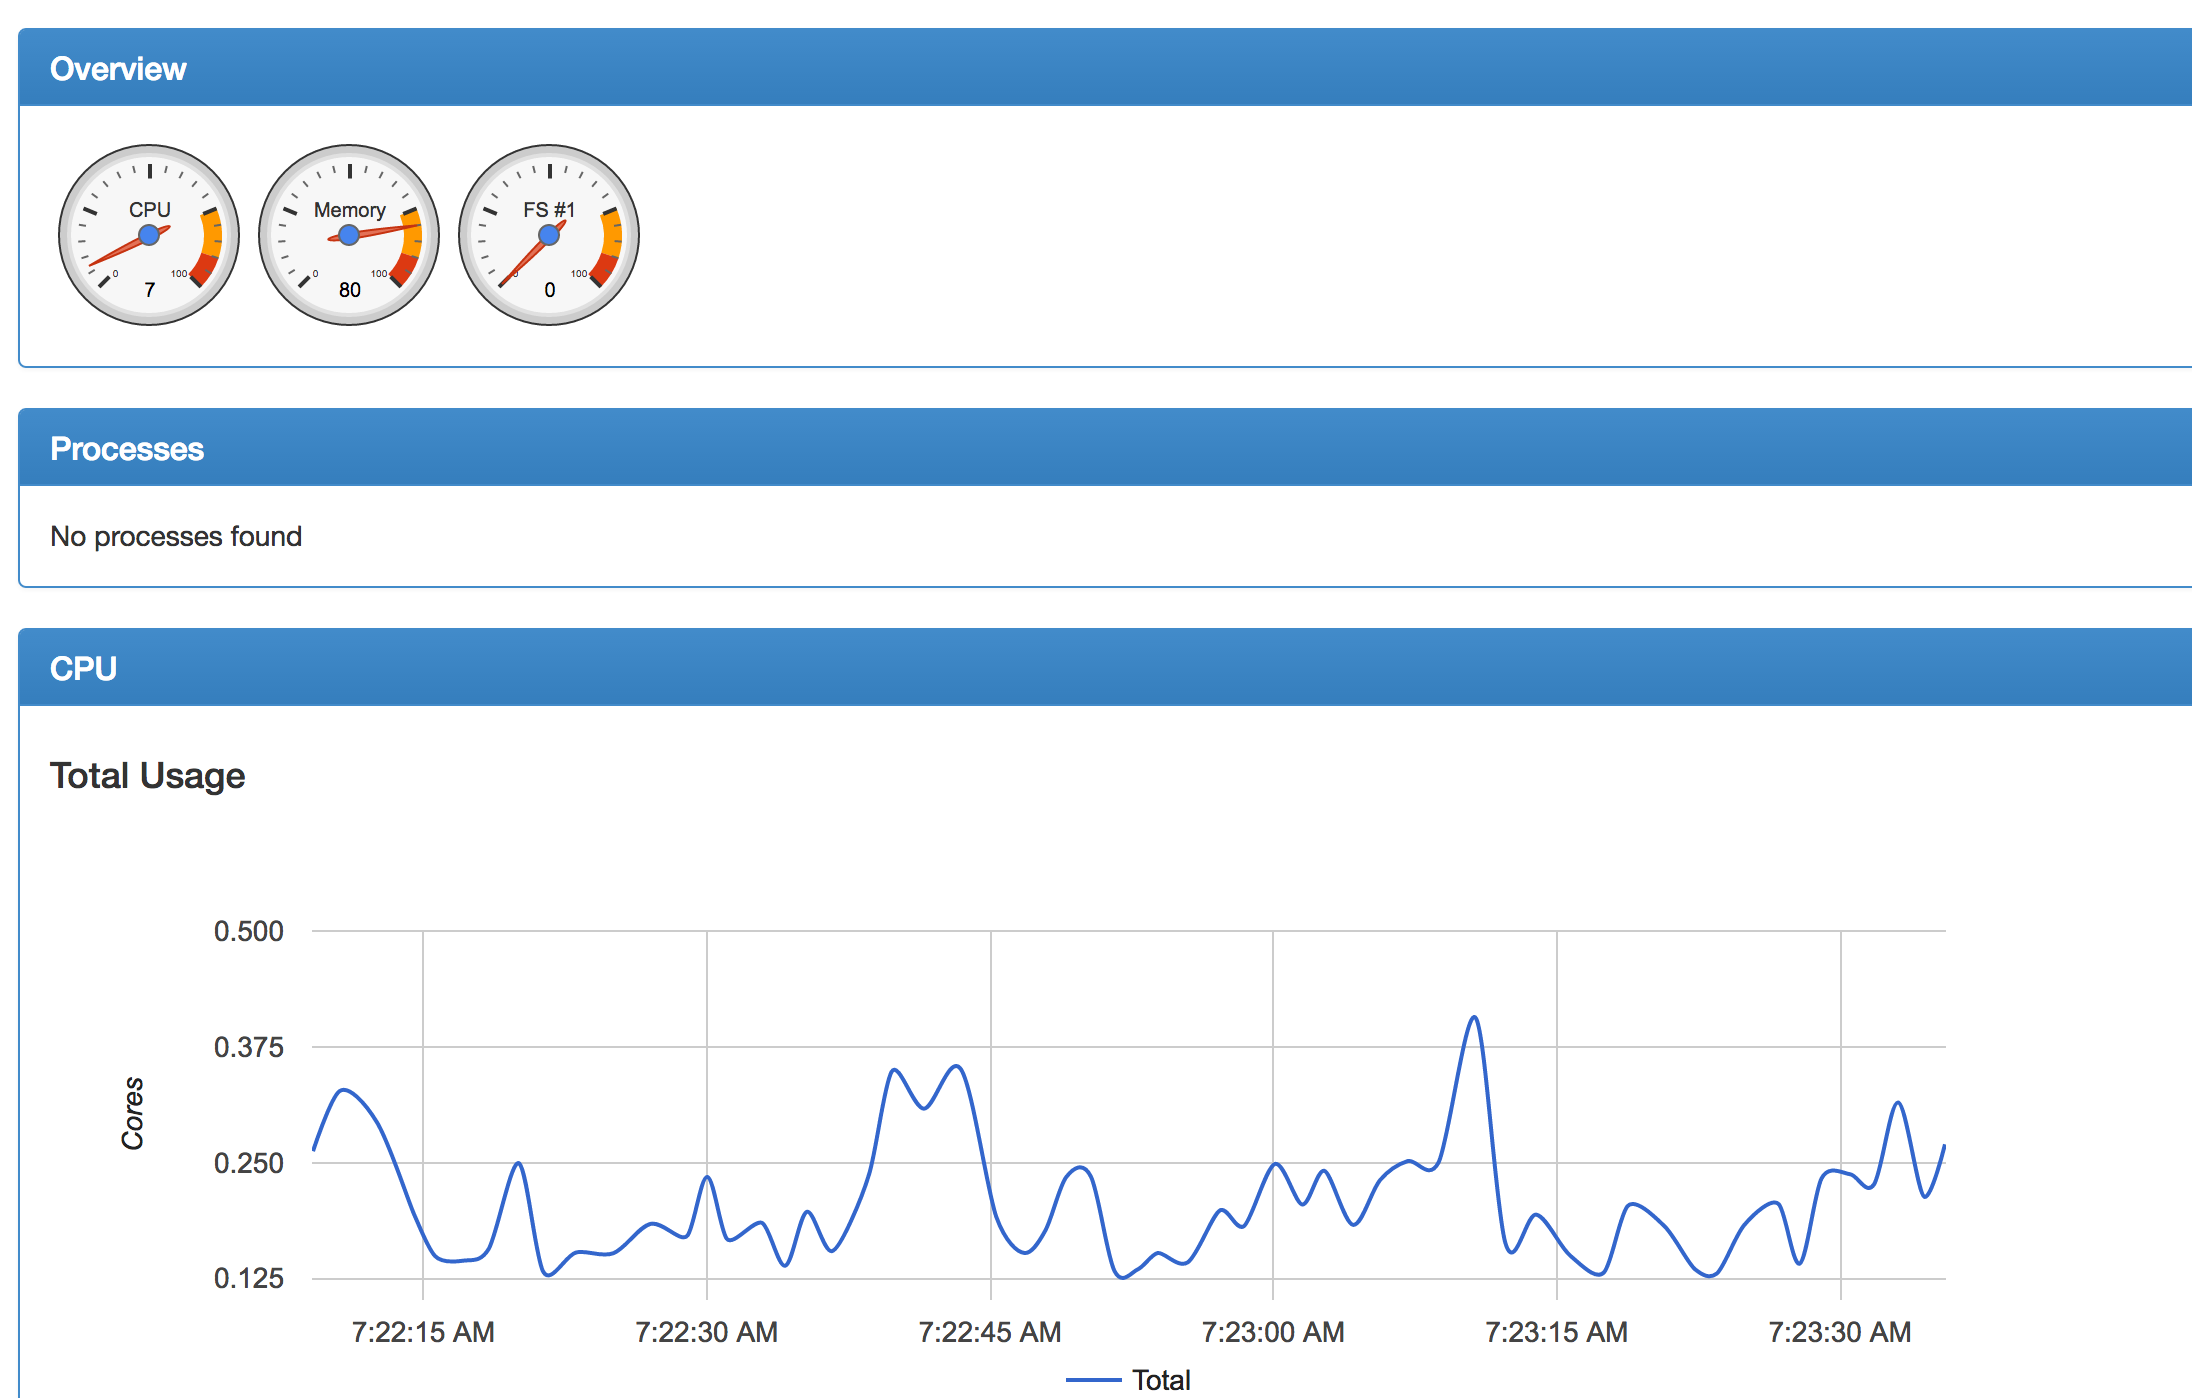
Google caAdvisor
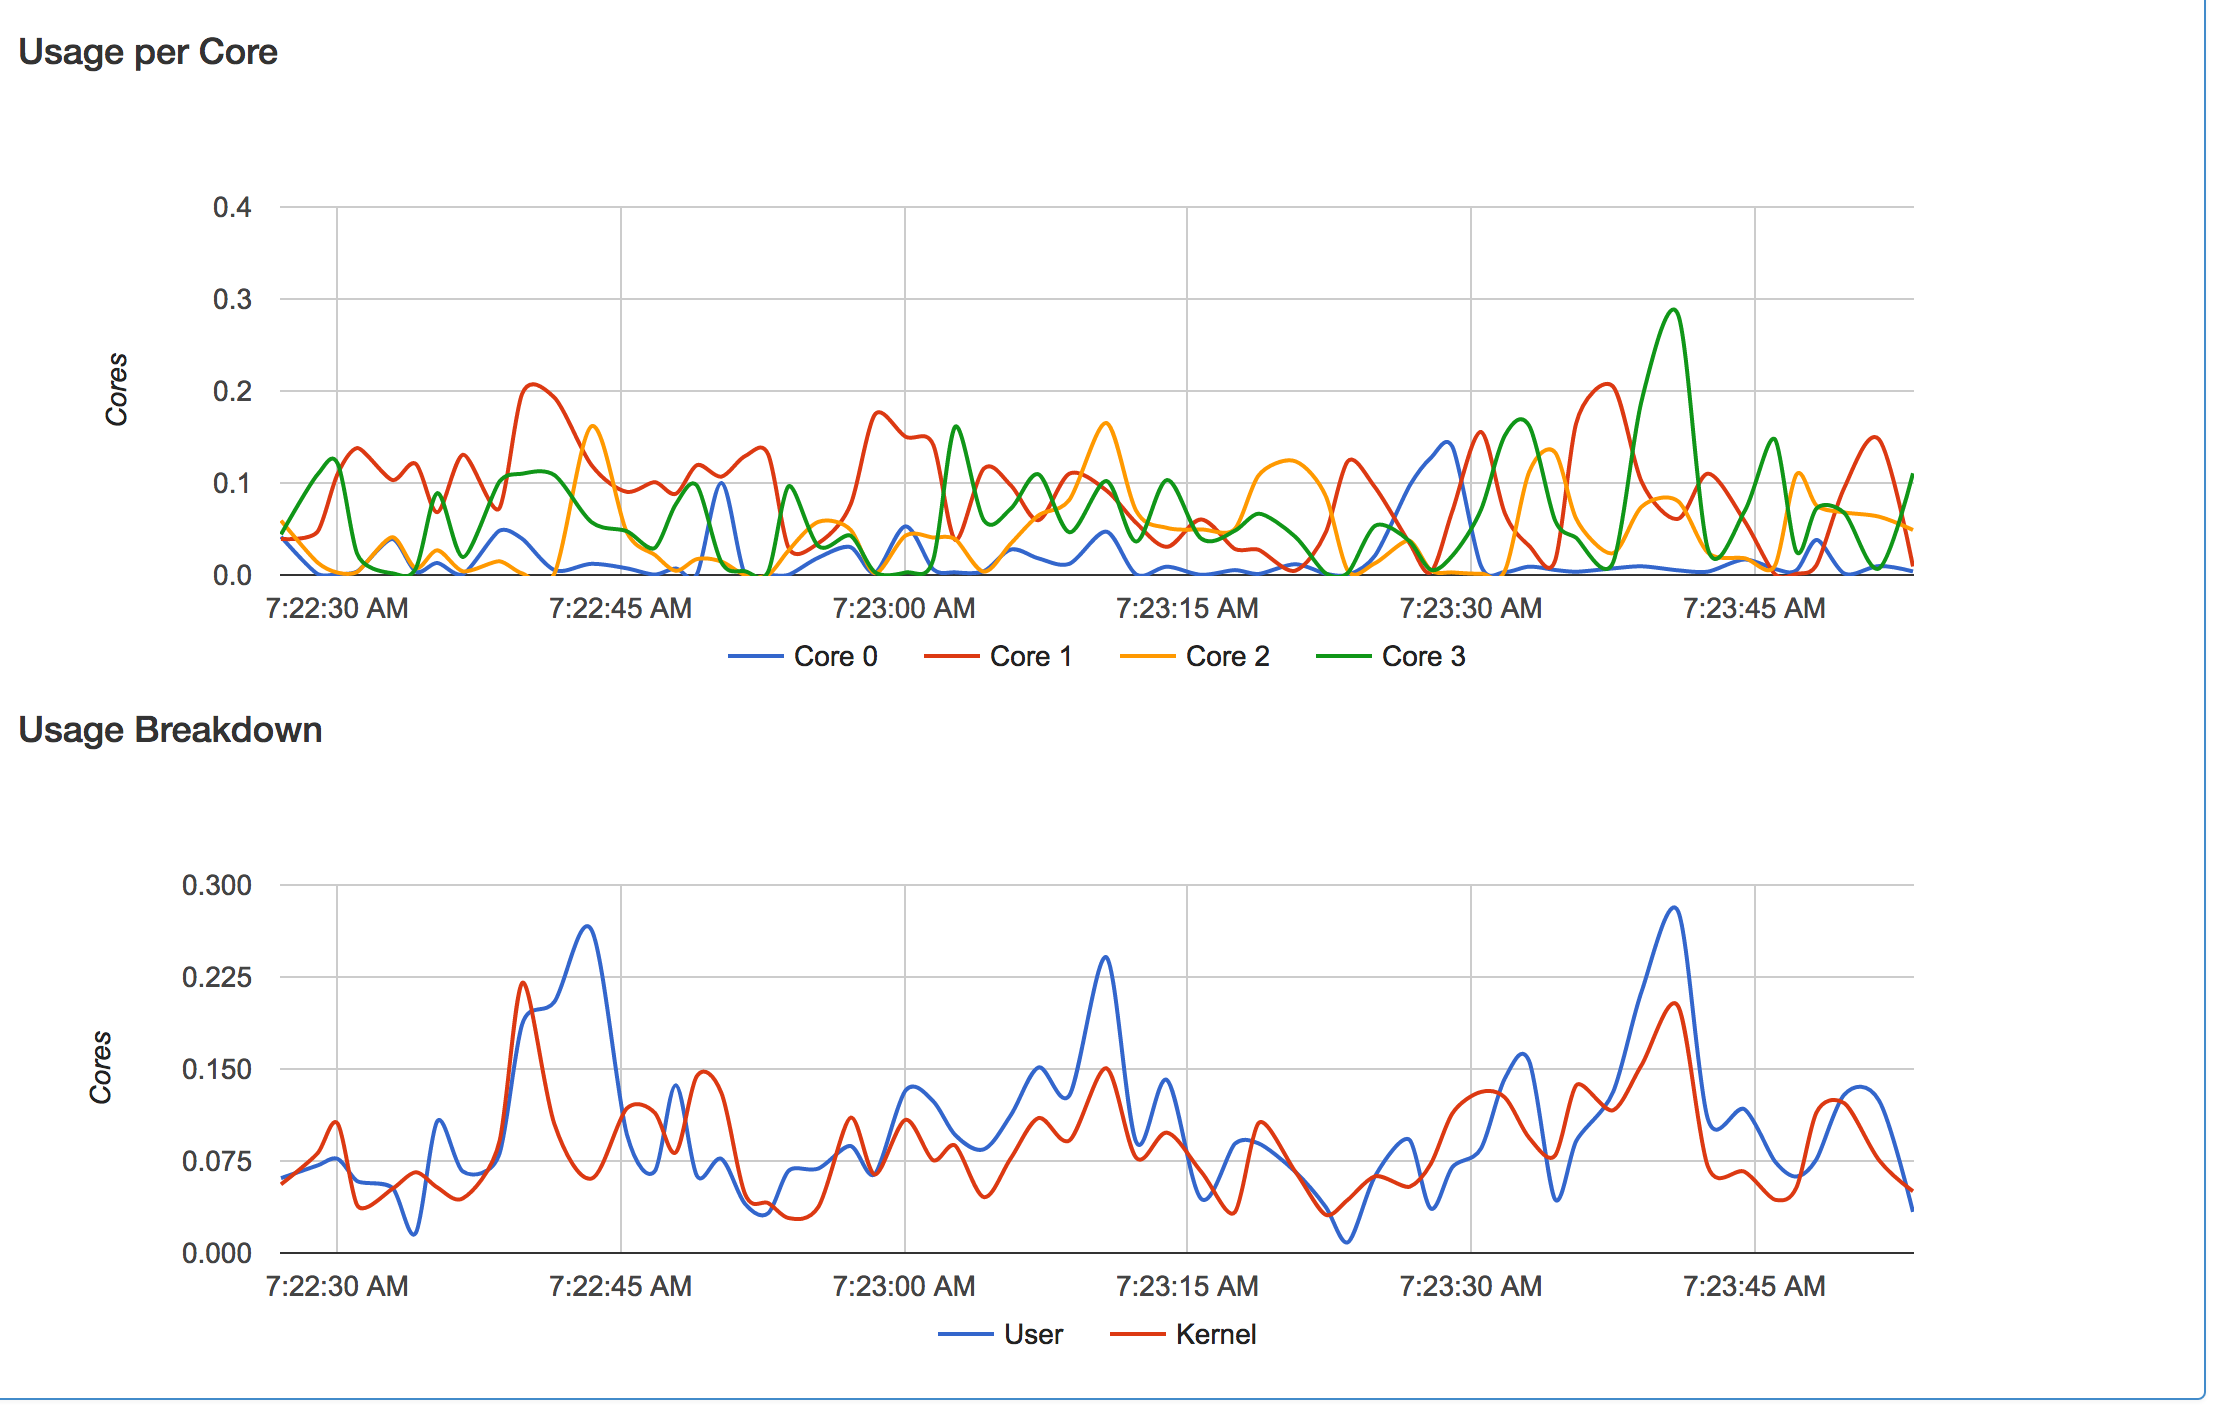
cAdvisor allows you getting stats information about resource usage and the various performance metrics for your containers. You have a simple web UI that can be accessing hitting http://localhost:8080 ( in case you mapped 8080 to your host port as I did in the example below)
sudo docker run \
  --volume=/:/rootfs:ro \
  --volume=/var/run:/var/run:rw \
  --volume=/sys:/sys:ro \
  --volume=/var/lib/docker/:/var/lib/docker:ro \
  --publish=8080:8080 \
  --detach=true \
  --name=cadvisor \
  google/cadvisor:latest
Some screenshots to get an idea
It also exposes an API that gives you access to valuable information such as
- List of subcontainers
- ContainerSpec which describes the resource isolation enabled in the container
- Detailed resource usage statistics of the container for the last N seconds (N is globally configurable in cAdvisor)
- Histogram of resource usage from the creation of the container